AWS: CloudWatch — Multi source query: collecting metrics from an external Prometheus

Another interesting announcement from the last re:Invent is that CloudWatch has added the ability to collect metrics from external resources (see a very interesting report AWS re:Invent 2023 — Cloud operations for today, tomorrow, and beyond (COP227)).
That is, we can now create graphs and/or alerts not only from the default metrics of CloudWatch itself, but also use CloudWatch connectors to connect metrics collection from Amazon Managed Service for Prometheus, regular Prometheus, Amazon OpenSearch Service, Amazon RDS for MySQL and PostgreSQL, CSV files from S3 buckets, and even Microsoft Azure Monitor.
Connecting metrics from a vanilla Prometheus
We have Prometheus on a bare-metal EC2 instance with port 9090 open — let’s try it here first, then look at VictoriaMetrics in EKS.
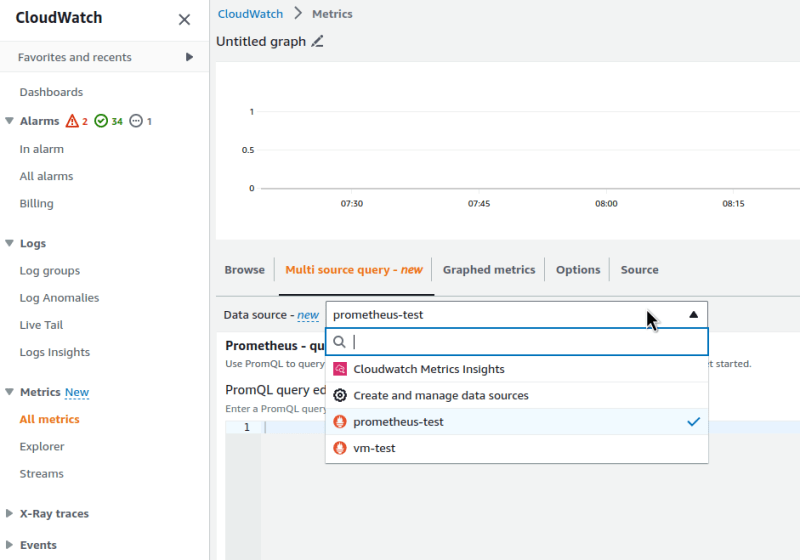
Go to CloudWatch Metrics, and here now we have a new tab — Multi source query:
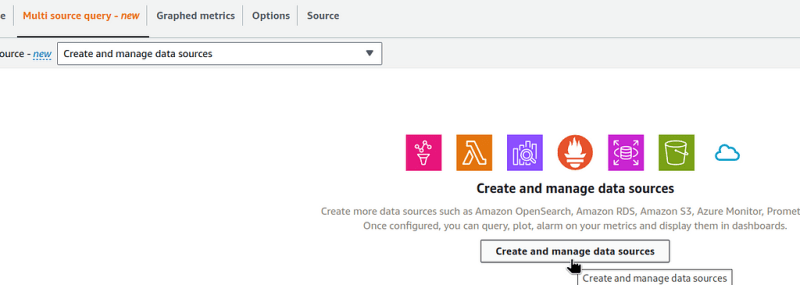
Choose Prometheus:

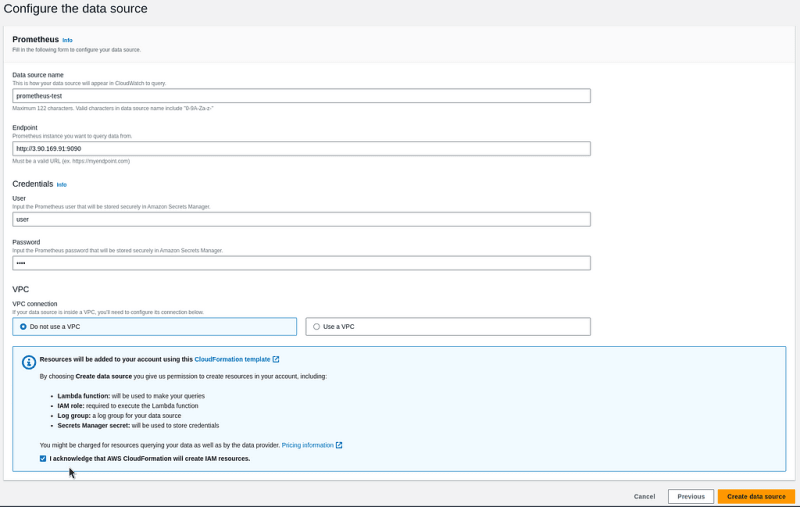
Set the parameters.
The login-password fields are required, so even if Prometheus does not require authentication, you should set some values here.
Below you can configure the network settings. For example, if your Prometheus is available only within a VPC, then you can select the VPC and subnets here:
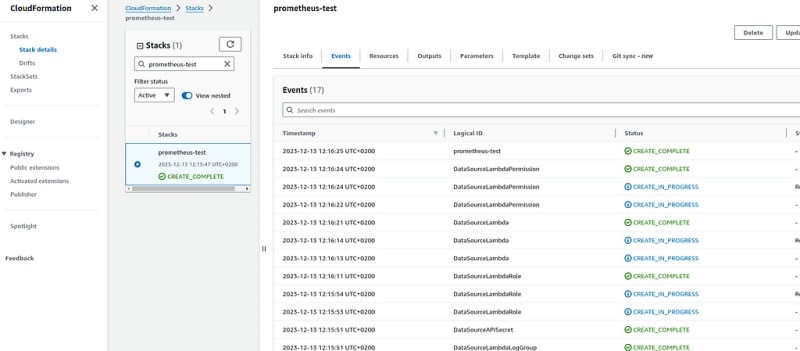
Click on the Create data source — CloudWatch will start creating a CloudFormation stack in which it will create a Lambda function that will actually collect data from our data sourcing:
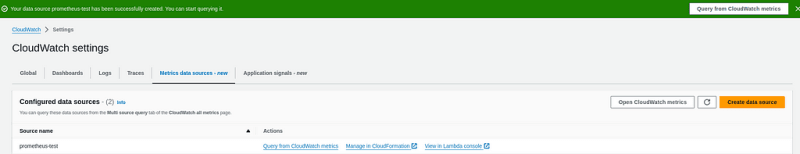
Go back to the CloudWatch, where we now have a new data source:
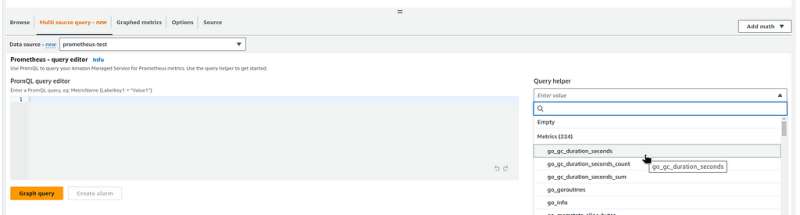
And we can get metrics from it:
VictoriaMetrics, EKS, and VPC
Now we have VictoriaMetrics in Kubernetes, see VictoriaMetrics: deploying a Kubernetes monitoring stack.
For CloudWatch to be able to collect metrics, we need to open access to VMSingle.
Here we have two options — either regular Ingress/ALB, see values.yaml, or via VMAuth with authentication, see VictoriaMetrics: VMAuth - Proxy, Authentication and Authorization.
And when adding a data source to CloudWatch, the only difference from the regular Prometheus is the URI:
- Prometheus has an URI
hostname:9090/api/v1/labels - VictoriaMetrics with VMSingle has its URI
hostname:8429/prometheus/api/v1/labels
So in the data source, add it as https://vmsingle.ops.example.co/prometheus/.
Editing and deleting a data source
I didn’t see where and how to change any parameters or remove data source from the CloudWatch panel.
It seems that so far, data source can only be deleted through CloudFormation by deleting a corresponding stack.
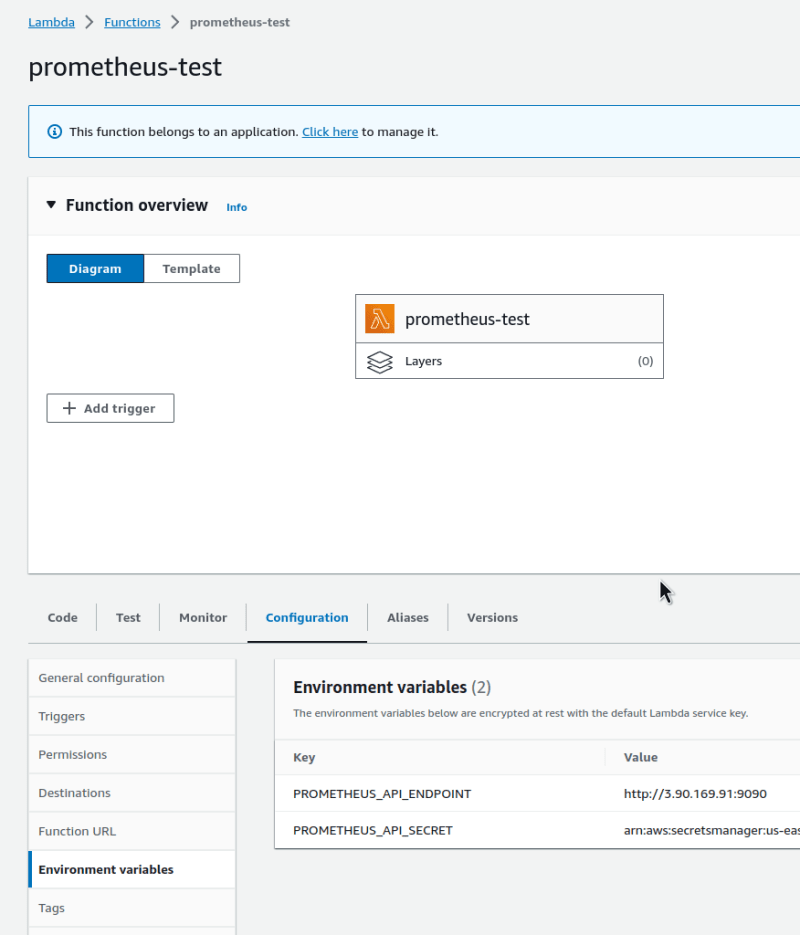
If you need to change some parameters, the only way O found is in the Lambda function itself.
For example, to edit the Prometheus URL, you can update it in the function’s environment variables:
But anyway, it all looks very cool.
Originally published at RTFM: Linux, DevOps, and system administration.

Top comments (0)