
This article was originally posted on SigNoz Blog and is written by Favour Daniel.
Grafana started as a data visualization tool. It slowly evolved into a tool that can take data from multiple data sources for visualization. For observability, Grafana offers the LGTM stack (Loki for logs, Grafana for visualization, Tempo for traces, and Mimir for metrics). You need to configure and maintain multiple configurations for a full-stack observability setup.
While Grafana offers great visualization capabilities, it lacks advanced analytics features that organizations with complex data monitoring needs may require. For example, Loki is the product by Grafana for log management. It is designed to keep indexing low.
It does not support high cardinality. For example, if you create a label for the user's IP address, you will have thousands of log streams, as every user will have a unique IP. This can make Loki very slow as it requires building a huge index.
In this article, we will discuss the top 11 Grafana alternatives that you can choose from if you’re looking for a Grafana replacement.
Top Grafana Alternatives
- SigNoz (Open-Source)
- Kibana
- Datadog
- New Relic
- Splunk
- Prometheus
- Dynatrace
- AppDynamics
- VictoriaMetrics
- Metabase
- Zabbix
SigNoz
SigNoz can be a great Grafana alternative. SigNoz is also open-source, just like Grafana. So, if you want to self-host SigNoz, clone the GitHub repo to get started.
Under the hood, Grafana is powered by multiple tools like Loki, Tempo, Mimir & Prometheus. SigNoz is built as a single tool to serve logs, metrics, and traces in a single pane of glass. SigNoz uses a single datastore - ClickHouse to power its observability stack. This makes SigNoz much better in correlating signals and driving better insights.
SigNoz is built to support OpenTelemetry. OpenTelemetry is an open-source standard for generating telemetry signals, which allows you to avoid vendor lock-in and provides flexibility in choosing different backends for different signals.
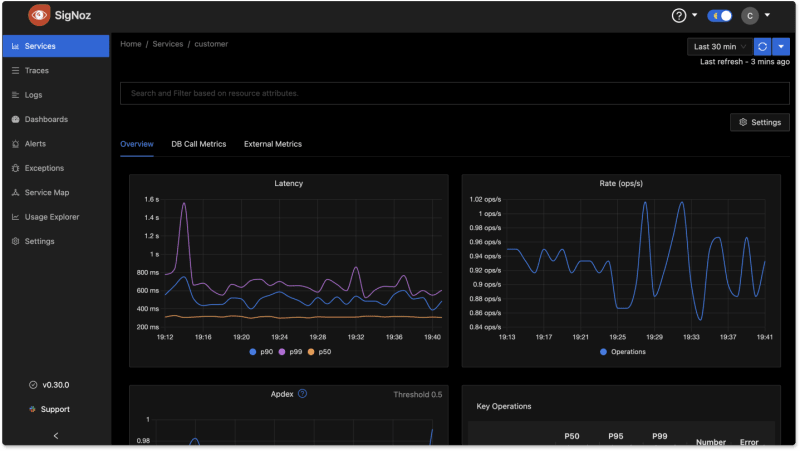
SigNoz comes with out-of-the-box APM charts like p90, p99 latency, request rates, and error rates. You can also monitor database calls and external calls as soon as you instrument your application with OpenTelemetry SDKs.
SigNoz offers comprehensive insights into tracing data through visual representations like Flamegraphs and Gantt charts. The Gantt charts provide a clear visual hierarchy of services and events, easily identifying latency-causing events in a request call.
 Flamegraphs showing the exact duration taken by each spans - a concept of distributed tracing
With SigNoz, you have the capability to perform aggregates on traces, allowing you to gain deeper insights into both your application and infrastructure.

Querying logs in SigNoz is fast, and an advanced query builder lets you search through your logs data easily.

Kibana
Kibana is an open-source data visualization tool that can serve as a good alternative to Grafana for real-time data visualization and analysis, particularly excelling in log and event data analysis. Kibana wasn’t designed as a stand-alone tool; it is a part of the Elastic Stack (ELK), where it collects log data from Logstash and stores it in Elasticsearch.
Kibana is an integral component within the Elastic Stack (ELK), offering advanced visualization and analysis capabilities. Beats, which is also a part of the ELK Stack, is responsible for collecting and forwarding log data to Logstash for initial processing. Logstash, in turn, applies various data transformations and subsequently stores the processed data in Elasticsearch. Finally, Kibana provides a user-friendly interface for visualizing and analyzing the stored data, completing the comprehensive data pipeline.
Some key features of Kibana include:
- An intuitive interface for crafting informative dashboards
- Robust querying and powerful search capabilities, making it ideal for in-depth log data investigation
- Dynamic and real-time visualizations of data
- Seamless integration with the Elastic Stack

Datadog
Datadog is a robust alternative to Grafana, providing a comprehensive observability platform for monitoring, visualizing, and analyzing metrics, logs, and traces from applications. Its rich array of functionalities caters specifically to the intricate monitoring needs of larger enterprises. This in turn positions Datadog as the go-to choice for many large-scale organizations, surpassing Grafana in meeting their comprehensive monitoring requirements.
Additionally, Datadog is designed to scale with the demands of modern, dynamic environments. This scalability is essential for organizations dealing with large-scale infrastructures and distributed systems, where the ability to monitor a diverse range of services and technologies is crucial for maintaining operational efficiency.
Some key features of Datadog include:
- Pre-built and customizable dashboards
- Application Performance Monitoring
- Security Monitoring
- Infrastructure Monitoring
- Network Monitoring

New Relic
New Relic is a comprehensive observability platform offering a compelling alternative to Grafana. Unlike conventional monitoring solutions, it takes a holistic approach, covering applications, infrastructure, and user experiences. By employing an agent-based monitoring system across servers, containers, and applications, New Relic delivers detailed performance insights. Its seamless integration with various third-party tools, coupled with scalability and enterprise-grade support, solidifies its standing as a formidable Grafana alternative.
Features of New Relic include:
- Log management
- APM
- Real user monitoring
- Synthetic monitoring
- Distributed tracing
- Customizable alerts
- Robust dashboard creation

Splunk
Splunk is a powerful centralized log management platform that excels in collecting and storing extensive data from diverse sources, including messaging systems, databases, and network devices. It allows real-time data search and analysis through a web interface, complemented by pre-built visualizations for swift dashboard creation.
Splunk's strengths lie in its adeptness at handling large-scale data ingestion and robust analytics capabilities. This makes it invaluable for organizations with complex data monitoring needs, particularly in enterprise security and observability.
Splunk’s key features include:
- User-friendly interface
- Pre-built and customizable dashboards
- Real-time data search and analysis
- Collection and analysis of data from diverse sources

Prometheus
Prometheus is used as a metrics monitoring tool. It was initially developed at SoundCloud in 2012 before being released as an open-source project. It got accepted into the CloudNative Computing Foundation in 2016 and was the second project to graduate from the foundation, following Kubernetes.
Prometheus is a good tool for monitoring any kind of time-series data. By time-series data, we mean metrics that change over time. For example, requests per second on an endpoint.
It can be used as a Grafana alternative if you just want to do metrics monitoring. But its visualization layer is very basic, and it is often used with Grafana for monitoring where Grafana lets you choose Prometheus as a data source.
Some of the key features of Prometheus are:
- multi-dimensional data model
- a query language called PromQL to query the metrics data collected
- pull model data collection over HTTP
- an alert manager to handle alerts
Dynatrace
Dynatrace is a comprehensive observability and application performance management (APM) platform designed for monitoring that can be used as a Grafana alternative. It offers a wide range of features and capabilities to monitor, diagnose, and optimize application performance in complex, dynamic environments.
Some of the key features of Dynatrace are:
- Application Monitoring: Dynatrace automatically discovers and monitors applications and services, regardless of their environment
- User Experience Monitoring: It captures real user interactions with applications, providing insights into user behavior and experience.
- Infrastructure Monitoring: Dynatrace monitors the underlying infrastructure, including servers, virtual machines, containers, and cloud services.
- Integration: It offers integrations with other observability tools, DevOps pipelines, and collaboration platforms to streamline workflows.

AppDynamics
AppDynamics is an enterprise Application Performance Management (APM) solution known for its comprehensive monitoring capabilities. It provides in-depth visibility into application performance and user experiences, offering code-level diagnostics, transaction tracing, and real-time insights.
AppDynamics is compatible with major technologies and can be deployed on-premise or as a Software-as-a-Service (SaaS) solution. It operates by installing an Agent in the application to collect performance metrics, which are then processed and presented via a web interface.
The platform stands out for its clean and modern UI, featuring heat maps for a clearer overview of metrics.

VictoriaMetrics
VictoriaMetrics is primarily a time-series database designed for efficiently storing and querying time-series data. It is often used as a back-end data store for time-series data generated by monitoring systems like Prometheus. VictoriaMetrics excels at handling large volumes of time-series data, offering efficient storage and query capabilities.
VictoriaMetrics can be an alternative to Grafana Mimir which is focused on long-term storage of Prometheus. The same company has also launched VictoriaLogs which can be a good alternative to Grafana Loki.
Metabase
Metabase is an open-source, powerful analytics tool that empowers users to glean insights and make informed decisions from their company's data. It's widely regarded as a suitable alternative to Grafana, focusing on simplicity and ease of use for a more straightforward analytics experience.
Metabase is tailored for exploring and querying structured data within databases. It empowers users with an intuitive interface to effortlessly create and share interactive dashboards, facilitating seamless data exploration. One of its notable advantages is the accessibility it offers to non-technical users, granting them the ability to create their own charts without relying on the data team.
Some key features of Metabase include:
- Ad-hoc querying
- Ease of use
- High-quality data visualizations
- User-friendly
)](https://res.cloudinary.com/practicaldev/image/fetch/s--d3EdA51s--/c_limit%2Cf_auto%2Cfl_progressive%2Cq_auto%2Cw_800/https://signoz.io/img/blog/2023/09/metabase-visualization-options.webp)
Zabbix
Zabbix is a comprehensive open-source monitoring solution designed for real-time monitoring and management of various network components, such as servers, networks, and applications. It excels in data collection and processing, enabling proactive monitoring for early issue detection and resolution.
Zabbix offers a unified view of the entire IT infrastructure through its user-friendly web-based interface. It delivers potent visualization capabilities through customizable dashboards, complemented by robust alerting mechanisms and comprehensive support for alert escalations.
Some of the key features of Zabbix include:
- Highly configurable alerting
- Flexible data collection
- Real-time graphing for metrics visualization
- Alerting features to notify administrators of any deviations from predefined thresholds
- User-friendly web-based interface
- Visualization capabilities through customizable dashboards

Choosing the right Grafana Alternative
Understanding your application's performance and behavior is paramount for optimal functionality. While Grafana excels in visualizing time-series data, it's important to recognize that it may fall short in providing the comprehensive monitoring and observability solution your application needs, as it primarily focuses on data visualization.
For a truly holistic approach to managing your applications' performance and behavior, you need a tool that offers advanced capabilities beyond visualization.
With over 14k+ Github stars, 100+ contributors, and 20k+ community members, SigNoz can be right alternative to Grafana as it is also open-source. SigNoz provides a one-stop solution to all your observability needs with logs, metrics, and traces under a single pane of glass.
Getting started with SigNoz
SigNoz cloud is the easiest way to run SigNoz. You can sign up here for a free account and get 30 days of free uncapped usage.
You can also install and self-host SigNoz yourself. It can be installed on macOS or Linux computers in just three steps by using a simple install script.
The install script automatically installs Docker Engine on Linux. However, on macOS, you must manually install Docker Engine before running the install script.
git clone -b main https://github.com/SigNoz/signoz.git
cd signoz/deploy/
./install.sh
You can visit our documentation for more installation option.

If you liked what you read, then check out our GitHub repo 👇
Related Posts

Top comments (0)