
They say that an image is a thousand words, but when you have a thousand images you will need to come up with interesting ways to display them. So here's what I've come up with:
It's a travel map component that is part of a larger MERN Stack app, developed with Typescript. It displays markers for various European countries using the react-simple-maps library. To install with NPM, use:
npm i -S react-simple-maps
Let's break down the three main files we will use:
File 1 (markers.ts):
Within the first file, markers.ts we have defined an array called markers. Each element in the array represents a geographical marker for a European country. These markers have properties like coordinates (latitude and longitude), fill color, and text labels, which are essential for rendering on the map.
const markers = [
    { coordinates: [-3.1883, 55.9533], fill: "#F53", text: "Scotland" },
    { coordinates: [-1.7278, 53.5074], fill: "#05C", text: "England" },
    { coordinates: [-8.2603, 53.3498], fill: "#0AC", text: "Ireland" }
    // Add more coordinates for other European countries here
  ];

  export default markers;
File 2 (TravelMap.tsx):
Now, moving on to TravelMap.tsx. This is the main React component responsible for rendering the travel map. It imports data from other files, including travelmapdata.tsx and markers.ts. It uses the react-simple-maps library for map rendering. The component is divided into two columns, where the left side displays some information about the map, and the right side shows the actual map itself.
The react-simple-maps comes out the box pretty basic , but has a lot of room to work with. I've posted a link at the bottom of this article to their "Getting Started" section so you can try as well! All the code you need to get the map to appear is as follows:
import React from "react"
import { ComposableMap, Geographies, Geography } from "react-simple-maps"

const geoUrl =
  "https://raw.githubusercontent.com/deldersveld/topojson/master/world-countries.json"

export default function MapChart() {
  return (
    <ComposableMap>
      <Geographies geography={geoUrl}>
        {({ geographies }) =>
          geographies.map((geo) => (
            <Geography key={geo.rsmKey} geography={geo} />
          ))
        }
      </Geographies>
    </ComposableMap>
  )
}
Easy. There is a few different features that you can use straight away such as 'Annotation' and 'Graticule', however the one that I was most interested in was 'Marker'. It allows you to place a circle on a coordinate of your choosing. And if you will recall, I have created a whole file full of coordinates that I wish to use.
Which brings us along to our 3rd file:
File 3 (TravelMapData.tsx):
This component handles data fetching and processing. It uses Axios to make HTTP requests to retrieve image data related to travel. It then counts the number of images associated with each country and passes this data to the main map component (TravelMap.tsx).
useEffect(() => {
    axios
      .get<ImageData[]>("http://localhost:5000/images/")
      .then((response) => {
        // Count occurrences of each country
        const countryCounts: { [key: string]: number } = {};
        response.data.forEach((data) => {
          if (data.country in countryCounts) {
            countryCounts[data.country] += 1;
          } else {
            countryCounts[data.country] = 1;
          }
        });
This if else condition is looking for the same country name to appear. We need this to work otherwise every country will only appear as if they have 1 photo taken there.
        // Convert the countryCounts object to the array of CountryData
        const uniqueCountriesData: CountryData[] = Object.keys(countryCounts).map(
          (country) => ({
            country,
            count: countryCounts[country],
          })
        );

        // Call the prop function with the uniqueCountriesData
        onCountryData(uniqueCountriesData);
        setIsLoading(false); // Data has been fetched, so set isLoading to false

      })
      .catch((error) => {
        console.log(error);
      });
  }, []); // Add onCountryData as a dependency for useEffect

 if (isLoading) {
    return <p>Loading...</p>; // Display a loading message while fetching data
  }
I added the isLoading state as a large project may have thousands of images and this would be better to implement that to have a bare map on display!
A CRUD app has been created, which allows the user to upload images to the website and give them a location and title.

For each image is uploaded to the site, a snippet of data is saved in a MongoDB database that will look like this:
{
"_id":{"$oid":"646c6bc493d04bd54d458413"},
"src":"0ed50ffd-a196-4c28-9d1e-9e3c30579c76-1684827076823.jpg",
"width":{"$numberInt":"150"},
"height":{"$numberInt":"150"},
"country":"Scotland",
"subregion":"East Kilbride",
"caption":"Skateboarding",
}
Here we have a unique ID for all images, then the end of a URL that will join onto a web address for the image stored. I have also chosen to include "width" and "height" in my data, however that is for a masonry image gallery that is on another section of this app (I will write an article about that if people are interested!). "country" is probably the most important field here for us and we will see further down where it comes into play with out code. "Subregion" and "caption" are for aesthetic purposes as well.
If you don't want the hassle of creating a MongoDB and backend to manage this, you can copy the text above and save it in a separate file with other dummy data. This will allow you to work along with this article. I won't be going over the CRUD app in this post, but I can make another article about it if people are interested. The purpose of this article is to talk about the code that visualises travel data, specifically the number of photos taken in each country.
So, we can go back to our second file travelmap.tsx. We have our coordinates, we have our images and their data being fetched from our API, now we just have to display them. Let's look at how I've done this.
<ComposableMap
            projection="geoMercator"
            projectionConfig={{
              scale: 775,
              center: [0, 54], // Center of the map on initial load
            }}
            width={800}
            height={700}
          >
            <Geographies geography={geoUrl}>
              {({ geographies }: any) =>
                geographies.map((geo: any) => (
                  <Geography
                    key={geo.rsmKey}
                    geography={geo}
                    fill="#355233"
                    stroke="#3C629E"
                  />
                ))
              }
            </Geographies>

            {/* Render Markers for each country */}
            {uniqueCountryData.map((countryData) => {
              console.log("Rendering Marker for:", countryData.country);
              const marker = markers.find(
                (marker) => marker.text === countryData.country
              );

              if (marker) {
                return (
                  <Marker
                    key={countryData.country}
                    coordinates={marker.coordinates}
                  >
                    <circle r={countryData.count.toString()} fill={marker.fill} />
                    <text
                      textAnchor="start"
                      y={-15}
                      x={5}
                      style={{ fontFamily: "Roboto, sans-serif", fill: "#fff", fontWeight:'bold' }}
                    >
                     {marker.text}

                    </text>
                    <text x={5} style={{ fontFamily: "Roboto, sans-serif", fill: "#A0BCEB", fontWeight:'lighter' }}> Photos: {countryData.count.toString()}
                    </text>
                  </Marker>
                );
              }
              return null;
            })}
          </ComposableMap>
So here, we have as the root element for the rendering map. It uses 'projection' to specify the type of map that will display. The map uses 'scale' to control how zoomed the map is initially and 'center' determines the centre point of the map when it loads. Here, it's set to [0, 54], which means the map will be centred on the latitude 54 and longitude 0.
is used to render the geographical shapes on the map based on the data provided by the geoUrl. It fetches the geographical data from the specified URL and renders the shapes accordingly.
{({ geographies }: any) => ... }:
This is a function that takes the geographies object as a parameter. It's used to map over each geographical shape and apply rendering logic to it.
Within the geographies.map function, for each geographical shape (geo), a component is rendered.
key is set to geo.rsmKey to ensure React can efficiently update and re-render the components.
geography specifies the shape to render.
fill sets the fill color of the geographical shape.
stroke sets the stroke (border) color of the geographical shape.
{uniqueCountryData.map((countryData) => { ... })}:
This section iterates over the uniqueCountryData array, which contains information about the countries and the number of photos taken in each.
Inside the mapping function:
It logs a message to the console for each country being processed, which can be useful for debugging.
It searches for a corresponding marker in the markers array using the countryData.country as a reference.
If a matching marker is found, a component is rendered to place a marker on the map at the specified coordinates.
is used to render a marker on the map.
key is set to countryData.country to uniquely identify the marker.
coordinates specifies the latitude and longitude where the marker should be placed.
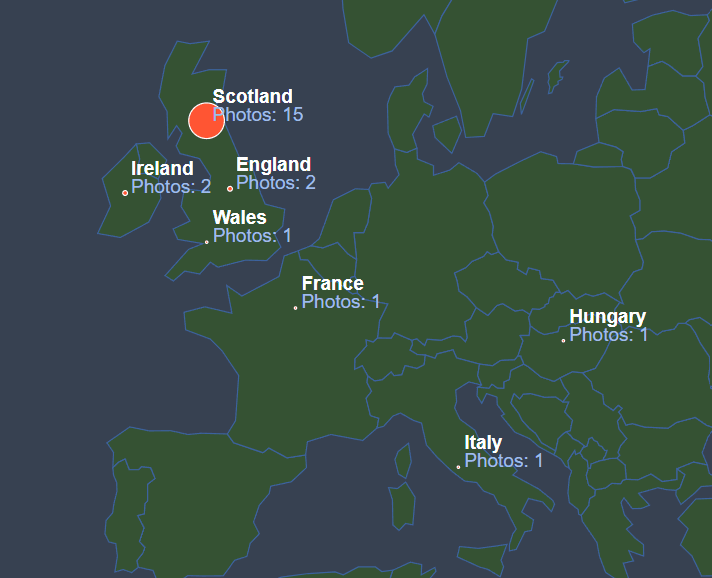
Inside a element is used to create a circular marker with a radius (r) proportional to the number of photos taken in that country. The more photographs, the larger the circle! It's important that (r) is represented as a string rather than a number, as the will not render at the correct size if (r) is a number. If it is I'm not sure why it won't accept a number instead of a string, and all my Google searches have yielded no results. If you know the reason, please leave a comment below!
Finally, we have two elements are used to display the country name and the count of photos next to the marker. And this is what we get when all the code works together:
I hope this has inspired you to see what you can come up with the react-simple-map. I think it might have to change its name now as its not so simple anymore!
This is part of an ongoing project that I am working on. I will have a working link to the whole site once I get a server up and running. If you have any questions about this, or would like to know more please reach out to me! I've linked the Git repo below, as well as the docs for react-simple-map.
Conclusion
We've delved into the world of code-driven map visualization using the react-simple-maps library. By dissecting geographical markers, data retrieval, and dynamic rendering, we've crafted an immersive travel map.
As you venture into your coding projects, remember that react-simple-maps is a powerful tool for creating interactive maps with your data. Whether it's displaying travel memories or visualizing complex datasets, this library provides the foundation.
I hope this article has equipped you with the knowledge to embark on your coding adventures. For a deeper dive into the code, explore my GitHub repository. And for more insights and resources, consult the react-simple-maps documentation linked below.
Happy coding, and may your projects thrive with innovative map-based solutions!

Top comments (0)