In order to add generics to header output in Kotlin Native, I had to kind of reverse engineer the Kotlin native compiler using a debugger 👎. Attaching a debugger to the Konan compiler requires a few steps, but is relatively straightforward.
Step 1: Build Kotlin Native
You’ll need to clone KN and make sure to create a branch pointing at the version you want to use. As the docs state, this will take at least an hour, and in my experience, that’s optimistic, but it’s generally a trouble free build. Just take a walk/nap.
Step 2: Create Sample Project
When you run into a compile issue, it may be in the context of a much larger application. While you could directly debug on that, I’d suggest making a minimal sample that surfaces the same issue. It’ll save you time.
Step 3: Config Sample Project
You need to point the sample project at your local Konan build, and tell the compiler you want to attach a debugger. Add the following to your gradle.properties:
org.jetbrains.kotlin.native.home=[Koltin Native Clone Dir]/dist
org.jetbrains.kotlin.native.jvmArgs=-agentlib:jdwp=transport=dt_socket,server=y,suspend=y,address=5006
Replace [Kotlin Native Clone Dir] with whatever dir you built KN in. That will tell the kotlin plugin to use that instead of the regular compiler and runtime. The second line makes the konan compiler wait for a remote debugger to connect.
Step 4: Config Remote Debugger (the easy part)
Open the Kotlin Native repo in Intellij (it’s a gradle project). Once that’s open, create a remote debugger config.
Edit Configurations
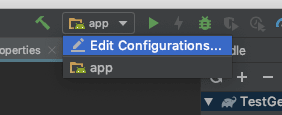
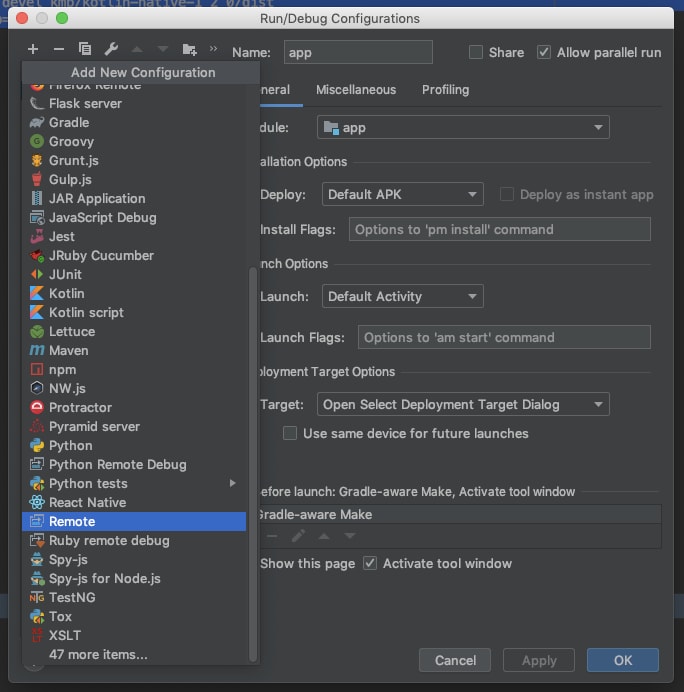
Add ‘Remote’
Set Port to 5006
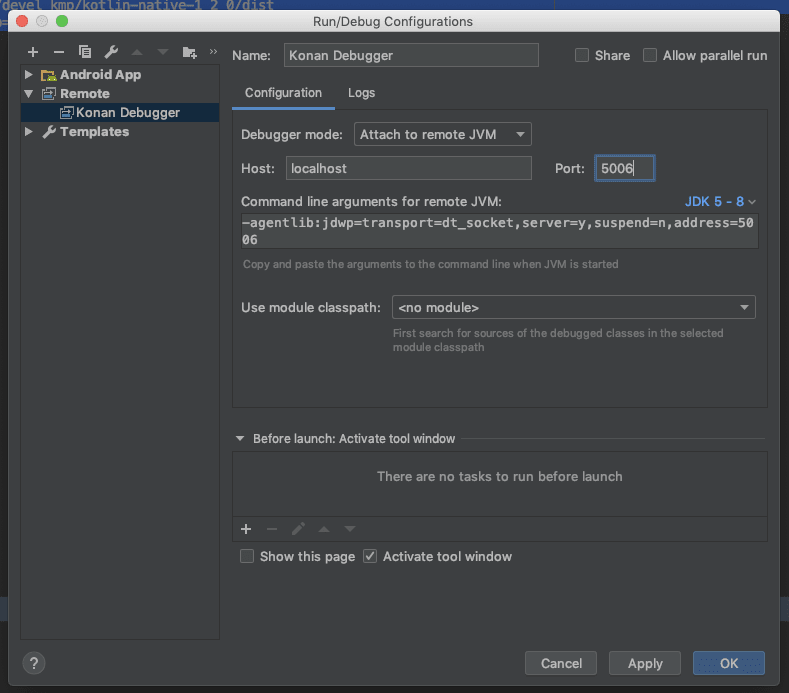
If you look back to step 3, we set the port to 5006
org.jetbrains.kotlin.native.jvmArgs=-agentlib:jdwp=transport=dt_socket,server=y,suspend=y,address=5006
Make sure that’s set in your Remote config.
Step 5: Profit
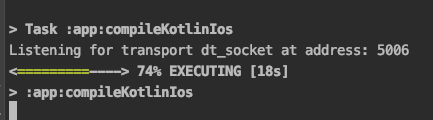
Now go back to your test project and build it. I generally do that on the command line with ./gradlew build. You’ll get a message telling you to attach a debugger.
Go back to the Kotlin Native Intellij project and run the Remote config. It’ll attach and let the compiler run.
In my testing, I actually needed to debug a different task, so I’d need to attach the debugger twice. I’d see this back in the sample project…
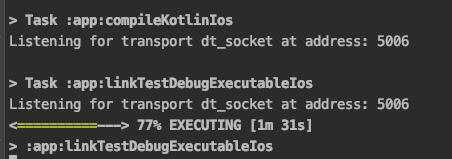
So, while a little clunky, just attach again.
Also, don’t forget to add breakpoints in the compiler code, which is the point.
Running the test app and debugger together in a video (sorry about audio. Will redo with a real mic if there’s interest)
👎 There is some anti-debugger feelings out there in TDD land, but the idea that debuggers are bad practice completely ignores the discovery use case, which is huge. This is a fantastic example of that. I really dislike the “real developers don’t use debuggers” attitude. Just ranting a bit about that here. Anyway…

Top comments (0)