Introduction
In todays blog I am going to go over Regularization for Machine Learning. More specifically L1 and L2 regularization, also known as Lasso and Ridge regularization.
Regularization is a method employed to penalize overfitting in a model to produce better results. In the case of Lasso and Ridge regression we are using penalized estimation to penalize the loss function, which also gives us another added bonus, feature reduction. These techniques are very similar in what they do, but differ in how it is how it is done, with a small tweak in the penalty term or regularization element.
Lasso
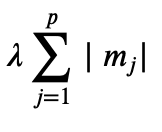
If we take a look at the last element of this function (the regularization element), we have the absolute value of the magnitude of the coefficients.

What this does is limit the size of the coefficients and in some cases reduces them to zero, or in other terms eliminates the feature all together. This reduction makes Lasso very useful if you have a large number of features.
Ridge
Comparatively here we have the cost function for Ridge. So again let's take a look at the regularization element. We can see that instead of having the absolute value of the magnitude of the coefficients, it is squared.

This case was actually developed to give better results for when the variables are correlated with each other. Though the negative with Ridge is that it does have the ability to reduce the number of features.
Example
First let's import our dataset and libraries that we will be using.
import pandas as pd
import numpy as np
from sklearn import metrics
import matplotlib.pyplot as plt
from sklearn.datasets import load_wine
from sklearn.linear_model import Lasso
from sklearn.linear_model import Ridge
from sklearn.linear_model import LinearRegression
from sklearn.model_selection import train_test_split
from sklearn.metrics import mean_squared_error, mean_squared_log_error
Now personally I like to view my datasets with pandas so I am going to convert it over.
wine = load_wine()
data = pd.DataFrame(data= np.c_[wine['data'], wine['target']],
                     columns= wine['feature_names'] + ['target'])
Linear Regression
Fitting our data to a normal Linear Regression model we can see that we are already have very good performance with this data, but let's take a look at what we can do with some regularization.
linreg = LinearRegression()
linreg.fit(Xtrain, ytrain)

ypred = linreg.predict(Xtest)

print('Training r^2:', linreg.score(Xtrain, ytrain))
print('Test r^2:', linreg.score(Xtest, ytest))
print('Training MSE:', mean_squared_error(ytrain, linreg.predict(Xtrain)))
print('Test MSE:', mean_squared_error(ytest, linreg.predict(Xtest)))
Lasso
lasso = Lasso(alpha=.0029) # Lasso is also known as the L1 norm
lasso.fit(Xtrain, ytrain)

print('Training r^2:', lasso.score(Xtrain, ytrain))
print('Test r^2:', lasso.score(Xtest, ytest))
print('Training MSE:', mean_squared_error(ytrain, lasso.predict(Xtrain)))
print('Test MSE:', mean_squared_error(ytest, lasso.predict(Xtest)))
Ridge
ridge = Ridge(alpha=1.151) # Ridge is also known as the L2 norm
ridge.fit(Xtrain, ytrain)

print('Training r^2:', ridge.score(Xtrain, ytrain))
print('Test r^2:', ridge.score(Xtest, ytest))
print('Training MSE:', mean_squared_error(ytrain, ridge.predict(Xtrain)))
print('Test MSE:', mean_squared_error(ytest, ridge.predict(Xtest)))
Finding Lambda Values
An important part of using regularization is setting your lambda value. Selecting too large of a lambda value will cause model to underfit, while the lower your lambda value gets the closer your model gets to just using linear regression, with zero being a linear regression model.
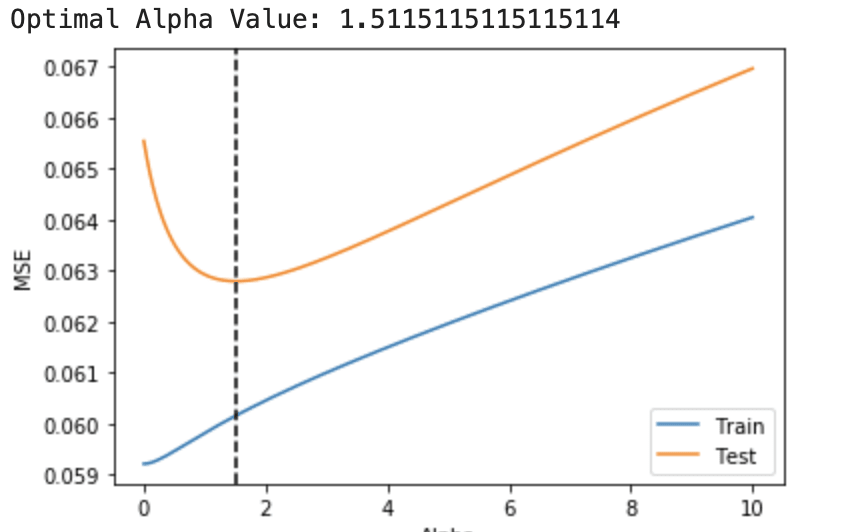
So I think the best way would be to graph the errors our model is getting with different values.
train_mse = []
test_mse = []
alphas = []

for alpha in np.linspace(0, 10, num=1000):
    ridge = Ridge(alpha=alpha)
    ridge.fit(Xtrain, ytrain)

    train_preds = ridge.predict(Xtrain)
    train_mse.append(mean_squared_error(ytrain, train_preds))

    test_preds = ridge.predict(Xtest)
    test_mse.append(mean_squared_error(ytest, test_preds))

    alphas.append(alpha)
fig, ax = plt.subplots()
ax.plot(alphas, train_mse, label='Train')
ax.plot(alphas, test_mse, label='Test')
ax.set_xlabel('Alpha')
ax.set_ylabel('MSE')

# np.argmin() returns the index of the minimum value in a list
optimal_alpha = alphas[np.argmin(test_mse)]

# Add a vertical line where the test MSE is minimized
ax.axvline(optimal_alpha, color='black', linestyle='--')
ax.legend();

print(f'Optimal Alpha Value: {float(optimal_alpha)}')
Now given our graph we can see there is a nice sweet spot for our lambda where the error for our testing is at it's lowest, giving us the balance between overfitting and underfitting!
Conclusion
Regression is a great way to handle overfitting especially when you have a large number of features. In the examples I provided it was minimal due to practice datasets being curated to give good results, though, out there when you are working with real world data give it a try, you will probably be surprised with how well it works!


Top comments (0)