Debugging React components can get tricky—especially when you’re trying to figure out how long something took or how many times a method was called. Wouldn’t it be great if we could add a simple hook to log:
- Component mount and unmount times
- Page reloads
- Method execution durations (with number of calls)
That’s exactly what we’ll build today: a reusable custom hook called useDebugLogger that makes tracking execution time a breeze.
What We’re Building
We’re going to build a hook that:
- Logs how long a component takes to mount (in ms).
- Logs when a component is unmounted.
- Logs if the user reloads the page.
- Logs how long any function (or async method) takes to run and how many times it’s been called.
It works like this:
const { logMethodExecution } = useDebugLogger("Home");

const myMethod = logMethodExecution("myMethod", () => {
  // your logic here
});
Let’s go step by step 👇
The Full Code
Here’s the final version of our useDebugLogger hook:
import { useEffect, useRef, useCallback } from "react";

const useDebugLogger = (componentName: string) => {
  const methodExecutionCount = useRef<Record<string, number>>({});

  // Log mount duration
  useEffect(() => {
    const mountStart = performance.now();
    const mountEnd = performance.now();
    console.log(
      `🔸 [${componentName}] Mounted in ${(mountEnd - mountStart).toFixed(2)}ms`
    );

    return () => {
      const endTime = new Date().toLocaleTimeString();
      console.log(`🔸 [${componentName}] Unmounted at: ${endTime}`);
    };
  }, [componentName]);

  // Log page reload
  useEffect(() => {
    const reloadHandler = () => {
      const reloadTime = new Date().toLocaleTimeString();
      console.log(`🔸 [${componentName}] Reload detected at: ${reloadTime}`);
    };

    window.addEventListener("beforeunload", reloadHandler);
    return () => {
      window.removeEventListener("beforeunload", reloadHandler);
    };
  }, [componentName]);

  // Method wrapper: logs execution time and call count
  const logMethodExecution = useCallback<
    <T extends (...args: unknown[]) => unknown>(methodName: string, method: T) => T
  >((methodName, method) => {
    return ((...args: Parameters<T>): ReturnType<T> => {
      methodExecutionCount.current[methodName] =
        (methodExecutionCount.current[methodName] || 0) + 1;
      const count = methodExecutionCount.current[methodName];

      const start = performance.now();
      console.log(
        `🔹 [${componentName}] ${methodName} started (Execution #${count})`
      );

      const result = method(...args);

      if (result instanceof Promise) {
        return result.finally(() => {
          const end = performance.now();
          console.log(
            `🔹 [${componentName}] ${methodName} finished after ${(end - start).toFixed(
              2
            )}ms (Execution #${count})`
          );
        }) as ReturnType<T>;
      } else {
        const end = performance.now();
        console.log(
          `🔹 [${componentName}] ${methodName} finished after ${(end - start).toFixed(
            2
          )}ms (Execution #${count})`
        );
        return result as ReturnType<T>;
      }
    }) as T;
  }, [componentName]);

  return { logMethodExecution };
};

export default useDebugLogger;
Breaking It Down
1. Mount Timing
useEffect(() => {
  const mountStart = performance.now();
  const mountEnd = performance.now();
  console.log(`[Component] Mounted in Xms`);
}, []);
This logs how long it took for the component to mount, using performance.now() for accuracy
2. Unmount Logging
return () => {
  const endTime = new Date().toLocaleTimeString();
  console.log(`[Component] Unmounted at: HH:MM:SS`);
};
Just a nice-to-have—tells us when the component is removed from the DOM.
3. Reload Tracking
useEffect(() => {
  const reloadHandler = () => {
    console.log(`[Component] Reload detected at: HH:MM:SS`);
  };
  window.addEventListener("beforeunload", reloadHandler);
  return () => window.removeEventListener("beforeunload", reloadHandler);
}, []);
This logs when a reload occurs (e.g. refreshing the browser).
4. Method Logger
const logMethodExecution = useCallback((methodName, method) => {
  return (...args) => {
    // logs start time
    const start = performance.now();

    // logs count
    // executes method and logs duration
  };
}, []);
Every time the method runs, you get:
- Execution count
- Time it started
- How long it took (with millisecond precision)
Example Usage in a Component
const { logMethodExecution } = useDebugLogger("Home");

const fetchData = logMethodExecution("fetchData", async () => {
  const res = await fetch("https://jsonplaceholder.typicode.com/posts/1");
  const data = await res.json();
  console.log("Data fetched:", data);
});

return (
  <button onClick={fetchData}>Fetch Data</button>
);
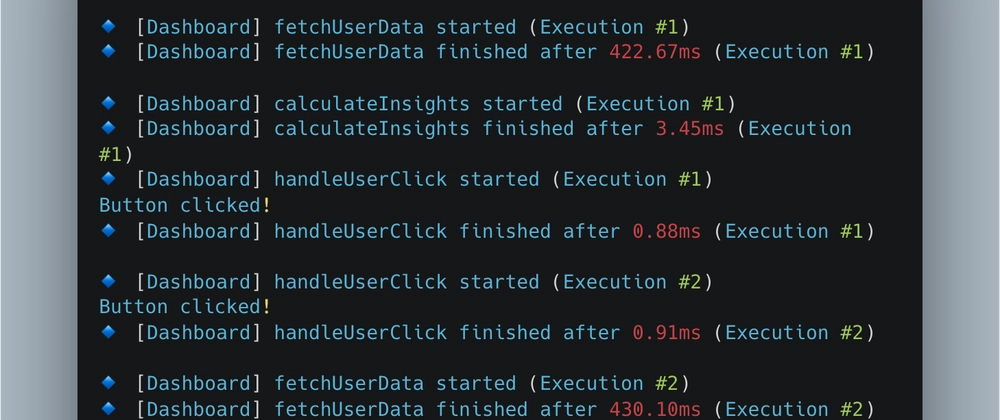
Console Output:
🔹 [Home] fetchData started (Execution #1)
Data fetched: { id: 1, title: ... }
🔹 [Home] fetchData finished after 412.77ms (Execution #1)
Why This Is Helpful
- Perfect for debugging performance in dev mode.
- Great for tracking repeated method calls or side effects.
- Easy to plug in and reusable across any component or method.
What You Can Add Next
- Add a global toggle to enable/disable logs
- Hook into error logging for catch cases
- Add logging for props and state diffs
Wrap-Up
The useDebugLogger hook gives you fine-grained insight into how your React components behave at runtime. It’s a lightweight and elegant way to track performance during development—without needing external tools.
Let me know if you want to turn this into a VSCode snippet or NPM package!
🙌 Feedback?
If this helped you, hit the ❤️ or 🦄 button, and feel free to drop a comment below. I’d love to hear how you would extend this idea!

Top comments (0)