
• introduce
• Learning outcomes
• Start a Substrate Template Node
• Configure Prometheus to scrape your Substrate node
• Visualizing Prometheus Metrics with Grafana
• Substrate Tutorials , Substrate 教程
• Contact 联系方式
• introduce
Recent versions of Substrate expose metrics, such as how many peers your node is connected to, how much memory your node is using, etc. To visualize these metrics, you can use tools like Prometheus and Grafana. In this tutorial you will learn how to use Grafana and Prometheus to scrape and visualize node metrics.
A possible architecture could look like:
+-----------+                     +-------------+                                                              +---------+
| Substrate |                     | Prometheus  |                                                              | Grafana |
+-----------+                     +-------------+                                                              +---------+
      |               -----------------\ |                                                                          |
      |               | Every 1 minute |-|                                                                          |
      |               |----------------| |                                                                          |
      |                                  |                                                                          |
      |        GET current metric values |                                                                          |
      |<---------------------------------|                                                                          |
      |                                  |                                                                          |
      | `substrate_peers_count 5`        |                                                                          |
      |--------------------------------->|                                                                          |
      |                                  | --------------------------------------------------------------------\    |
      |                                  |-| Save metric value with corresponding time stamp in local database |    |
      |                                  | |-------------------------------------------------------------------|    |
      |                                  |                                         -------------------------------\ |
      |                                  |                                         | Every time user opens graphs |-|
      |                                  |                                         |------------------------------| |
      |                                  |                                                                          |
      |                                  |       GET values of metric `substrate_peers_count` from time-X to time-Y |
      |                                  |<-------------------------------------------------------------------------|
      |                                  |                                                                          |
      |                                  | `substrate_peers_count (1582023828, 5), (1582023847, 4) [...]`           |
      |                                  |------------------------------------------------------------------------->|
      |                                  |                                                                          |
• Learning outcomes
Learn how to do a time-series scrape for a Substrate node using Prometheus
Learn how to use Grafana and Prometheus to visualize node metrics
• Start a Substrate Template Node
Before you continue here, you should complete the create your first substrate chain tutorial. The same substrate version, conventions for directory structure, and bin names are used here. You can of course use your own custom Substrate node instead of the template, just edit the commands shown as needed.
Substrate exposes an endpoint which serves metrics in the Prometheus exposition format available on port 9615. You can change the port with --prometheus-port and enable it to be accessed over an interface other than local host with --prometheus-external.
# Optionally add the `--prometheus-port <PORT>`
# or `--prometheus-external` flags
./target/release/node-template --dev
• Configure Prometheus to scrape your Substrate node
In the working directory where you installed Prometheus, you will find a prometheus.yml configuration file. Let's modify this (or create a custom new on) to configure Prometheus to scrape the exposed endpoint by adding it to the targets array. If you modify the default, here is what will be different:
# --snip--

# A scrape configuration containing exactly one endpoint to scrape:
# Here it's Prometheus itself.
scrape_configs:
  # The job name is added as a label `job=<job_name>` to any timeseries scraped from this config.
  - job_name: 'substrate_node'

    # metrics_path defaults to '/metrics'
    # scheme defaults to 'http'.

    # Override the global default and scrape targets from this job every 5 seconds.
    # ** NOTE: you want to have this *LESS THAN* the block time in order to ensure
    # ** that you have a data point for every block!
    scrape_interval: 5s

    static_configs:
      - targets: ['localhost:9615']
Now we can start a Prometheus instance with the prometheus.yml config file. Presuming you downloaded the binary, cd into the install directory and run:
# specify a custom config file instead if you made one here:
./prometheus --config.file prometheus.yml
• Visualizing Prometheus Metrics with Grafana
Now startup Grafana, and you will log in and navigate to it in a browser (the default is http://localhost:3000/). Log in (with the default user admin and password admin) and navigate to the data sources page at http://localhost:3000/datasources .
You then need to select a Prometheus data source type and specify where Grafana needs to look for it.
With your substrate node and Prometheus are running, configure Grafana to look for Prometheus on it's default port: http://localhost:9090 (unless you customized it).
Hit Save & Test to ensure that you have the data source set correctly. Now you can configure a new dashboard!
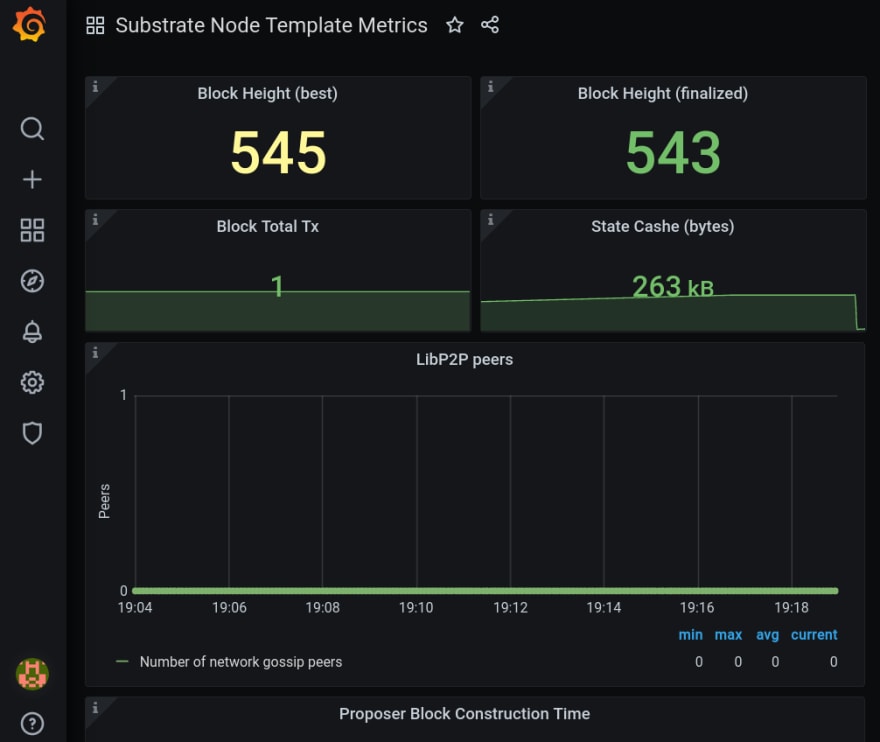
Template Grafana Dashboard
If you would like a basic dashboard to start here is a template example that you can Import in Grafana to get basic information about your node:
https://grafana.com/grafana/dashboards/13759/
• Substrate Tutorials , Substrate 教程
CN 中文 Github Substrate 教程 : github.com/565ee/Substrate_CN
CN 中文 CSDN Substrate 教程 : blog.csdn.net/wx468116118
EN 英文 Github Substrate Tutorials : github.com/565ee/Substrate_EN
EN 英文 dev.to Substrate Tutorials : dev.to/565ee
• Contact 联系方式
Homepage : 565.ee
GitHub : github.com/565ee
Email : 565.eee@gmail.com
Facebook : facebook.com/565.ee
Twitter : twitter.com/565_eee
Telegram : t.me/ee_565

Top comments (0)