This was originally published on my own site.
It was Indie Web Camp Brighton on the weekend. After a day of thought-provoking discussions, I thoroughly enjoyed spending the second day tinkering on my website.
For a while now, I’ve wanted to add maps to my monthly archive pages (to accompany the calendar heatmaps I added at a previous Indie Web Camp). Whenever I post anything to my site—a blog post, a note, a link—it’s timestamped and geotagged. I thought it would be fun to expose that in a glanceable way. A map seems like the right medium for that, but I wanted to avoid the obvious route of dropping a load of pins on a map. Instead I was looking for something more like the maps in Indiana Jones films—a line drawn from place to place to show the movement over time.
I talked to Aaron about this and his advice was that a client-side JavaScript embedded map would be the easiest option. But that seemed like overkill to me. This map didn’t need to be pannable or zoomable; just glanceable. So I decided to see if how far I could get with a static map. I timeboxed two hours for it.
After two hours, I admitted defeat.
I was able to find the kind of static maps I wanted from Mapbox—I’m already using them for my check-ins. I could even add a polyline, which is exactly what I wanted. But instead of passing latitude and longitude co-ordinates for the points on the polyline, the docs explain that I needed to provide …cur ominous thunder and lightning… The Encoded Polyline Algorithm Format.
Go to that link. I’ll wait.
Did you read through the eleven steps of instructions? Did you also think it was a piss take?
- Take the initial signed value.
- Multiply it by 1e5.
- Convert that decimal value to binary.
- Left-shift the binary value one bit.
- If the original decimal value is negative, invert this encoding.
- Break the binary value out into 5-bit chunks.
- Place the 5-bit chunks into reverse order.
- OR each value with 0x20 if another bit chunk follows.
- Convert each value to decimal.
- Add 63 to each value.
- Convert each value to its ASCII equivalent.
This was way beyond my brain’s pay grade. But surely someone else had written the code I needed? I did some Duck Duck Going and found a piece of PHP code to do the encoding. It didn’t work. I Ducked Ducked and Went some more. I found a different piece of PHP code. That didn’t work either.
At this point, my allotted time was up. If I wanted to have something to demo by the end of the day, I needed to switch gears. So I did.
I used Leaflet.js to create the maps I wanted using client-side JavaScript. Here’s the JavaScript code I wrote.
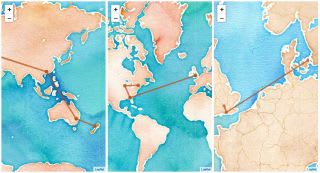
It waits until the page has finished loading, then it searches for any instances of the h-geo microformat (a way of encoding latitude and longitude coordinates in HTML). If there are three or more, it generates a script element to pull in the Leaflet library, and a corresponding style element. Then it draws the map with the polyline on it. I ended up using Stamen’s beautiful watercolour map tiles.
That’s what I demoed at the end of the day.
But I wasn’t happy with it.
Sure, it looked good, but displaying the map required requests for a script, a style sheet, and multiple map tiles. I made sure that it didn’t hold up the loading of the rest of the page, but it still felt wasteful.
So after Indie Web Camp, I went back to investigate static maps again. This time I did finally manage to find some PHP code for encoding lat/lon coordinates into a polyline that worked. Finally I was able to construct URLs for a static map image that displays a line connecting multiple points with a line.
I’ve put this maps on any of the archive pages that also have calendar heat maps. Some examples:
- Everything from August 2019
- Notes from July 2018
- Links from June 2017
- Photos from October 2014
- Journal entries from December 2012
If you go back much further than that, the maps start to trail off. That’s because I wasn’t geotagging everything from the start.
I’m pretty happy with the final results. It’s certainly far more responsible from a performance point of view. Oh, and I’ve also got the maps inside a picture element so that I can swap out the tiles if you switch to dark mode.
It’s a shame that I can’t use the lovely Stamen watercolour tiles for these static maps though.
This was originally published on my own site.

Top comments (0)