
This cheat sheet provides an overview of the most commonly used plotting functions and attributes in Julia using the popular plotting library Plots.jl. To get started, make sure you have the Plots package installed by running:
using Pkg
Pkg.add("Plots")
Then load the Plots library by running:
using Plots
Basic Plotting Functions
- Line plot:
function linePlot()
    x = 1:0.1:10
    y = cos.(x)
    plot(x, y, label="cos(x)")
end

function scatterPlot()
    x = 1:0.1:10
    y = cos.(x)
    scatter(x, y, label="cos(x)")
end

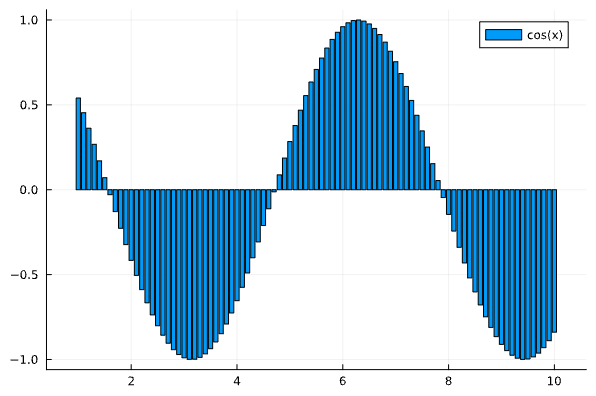
- Bar plot: ```
function barPlot()
x = 1:0.1:10
y = cos.(x)
bar(x, y, label="cos(x)")
end
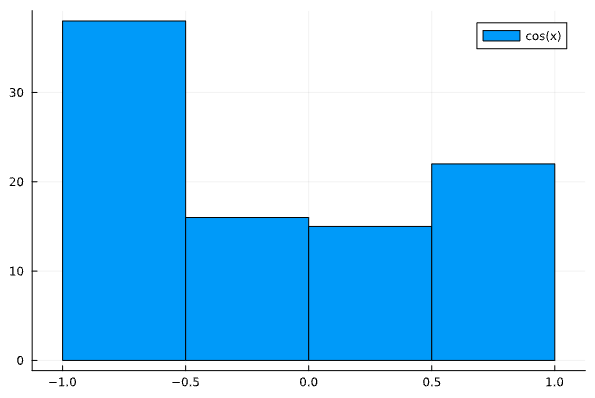
4. Histogram:
function histogramPlot()
x = 1:0.1:10
y = cos.(x)
histogram(x, y, label="cos(x)")
end
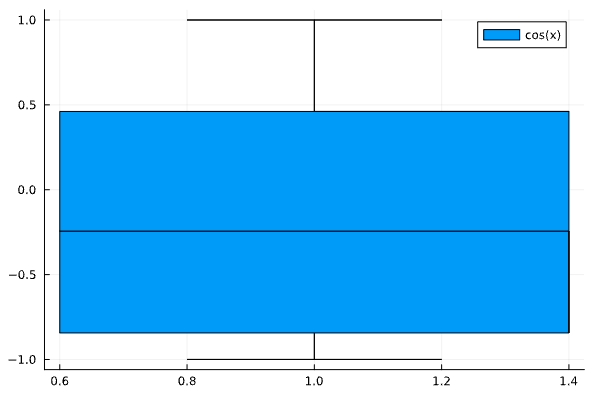
5. Box plot:
using StatsPlots
function boxPlot()
x = 1:0.1:10
y = cos.(x)
boxplot(x, y, label="cos(x)")
end
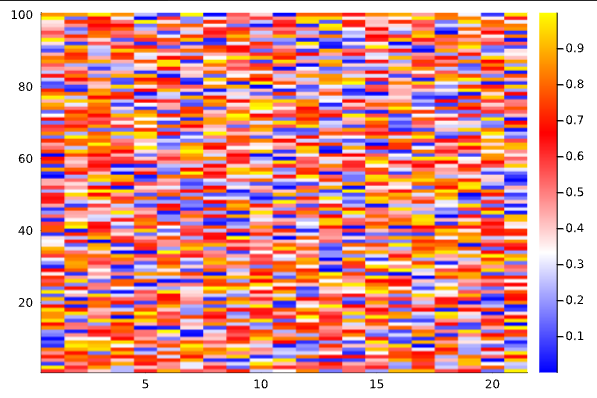
6. [Heatmap](https://docs.juliaplots.org/latest/generated/unitfulext_examples/#Heatmaps):
function heatmapPlot()
data = rand(21, 100)
heatmap(1:size(data, 1),
1:size(data, 2), data,
c=cgrad([:blue, :white, :red, :yellow]),
)
end
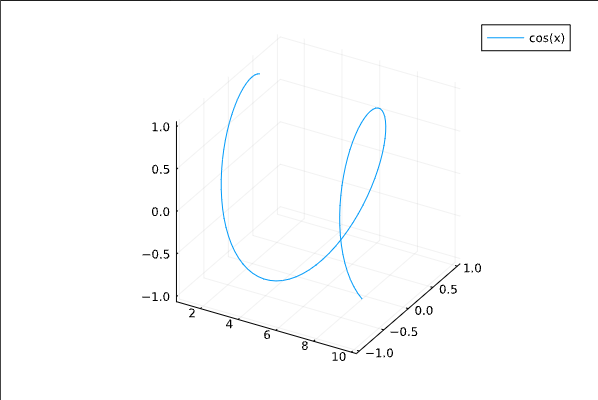
7. 3D plot:
function plot3D()
x = 1:0.1:10
y = cos.(x)
z = sin.(x)
plot3d(x, y, z, label="cos(x)")
end
## Common Plot Attributes
### Title, labels, and legend
- `title`: Plot title
- `xlabel`: x-axis label
- `ylabel`: y-axis label
- `zlabel`: z-axis label (for 3D plots)
- `legend`: Legend position
- :topleft
- :topright
- :bottomleft
- :bottomright
- :outertopleft
- :outertopright
- :outerbottomleft
- :outerbottomright
- :best
- :none
Example:
plot(x, y, title="My Line Plot", xlabel="x-axis", ylabel="y-axis", legend=:topleft)
### Line style
- `ls`: Line style
  - :solid
  - :dash
  - :dot
  - :dashdot
  - :dashdotdot
- `lw`: Line width

Example:
plot(x, y, ls=:dash, lw=2)
### Marker style
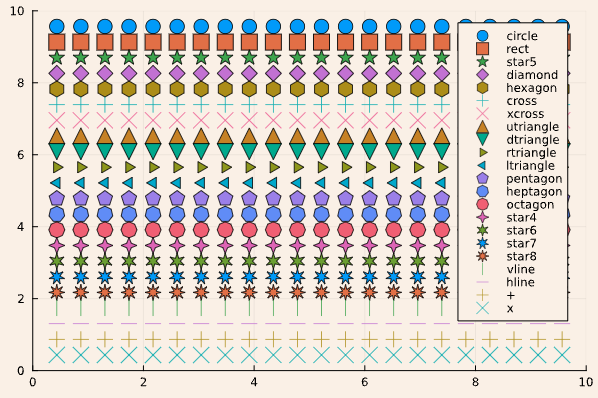
- `m`: Marker shape
- :circle
- :diamond
- :cross
- :xcross
- :utriangle
- :dtriangle
- :rtriangle
- :ltriangle
- :pentagon
- :hexagon
- :heptagon
- :octagon
- :star4
- :star5
- :star6
- :star7
- :star8
- :vline
- :hline
- :none)
- `ms`: Marker size
- `mc`: Marker color
Example:
scatter(x, y, m=:diamond, ms=5, mc=:red)
### Colors and styles
- `c`: Line or marker color
- `fillcolor`: Fill color (for bar plots, histograms, etc.)
- `fillalpha`: Fill transparency
- `alpha`: Line or marker transparency

Example:
bar(x, y, c=:blue, fillcolor=:orange, fillalpha=0.5, alpha=0.8)
### Axis limits and scales
- `xlims`: x-axis limits
- `ylims`: y-axis limits
- `zlims`: z-axis limits (for 3D plots)
- `xscale`: x-axis scale
  - :linear
  - :log10
  - :log2
  - :log
- `yscale`: y-axis scale
  - :linear
  - :log10
  - :log2
  - :log
- `zscale`: z-axis scale (for 3D plots)

Example:
plot(x, y, xlims=(0,10), ylims=(-1, 1), xscale=:log10, yscale=:linear)
### Grid, Ticks, and Background
- `grid`: Grid visibility (`:on`, `:off`)
- `gridcolor`: Grid color
- `gridalpha`: Grid transparency
- `gridstyle`: Grid style
  - :solid
  - :dash
  - :dot
  - :dashdot
  - :dashdotdot
- `xticks`: x-axis tick marks (vector of tick positions, `:auto`, `:none`)
- `yticks`: y-axis tick marks (vector of tick positions, `:auto`, `:none`)
- `zticks`: z-axis tick marks (for 3D plots)
- `tickfontsize`: Tick label font size
- `background_color`: Plot background color
- `foreground_color`: Plot foreground color

Example:
plot(x, y, grid=:on, gridcolor=:grey, gridalpha=0.5, gridstyle=:dash, xticks=0:2:10, yticks=:auto, tickfontsize=12, background_color=:white, foreground_color=:black)
## Subplots and Layouts
layout: Subplot layout (tuple of rows and columns, e.g. (2, 3) for 2 rows and 3 columns)
title: Titles for each subplot (vector of strings)
Example:
plot(x, [y1, y2, y3, y4, y5, y6], layout=(2, 3), title=["Plot 1" "Plot 2" "Plot 3" "Plot 4" "Plot 5" "Plot 6"])
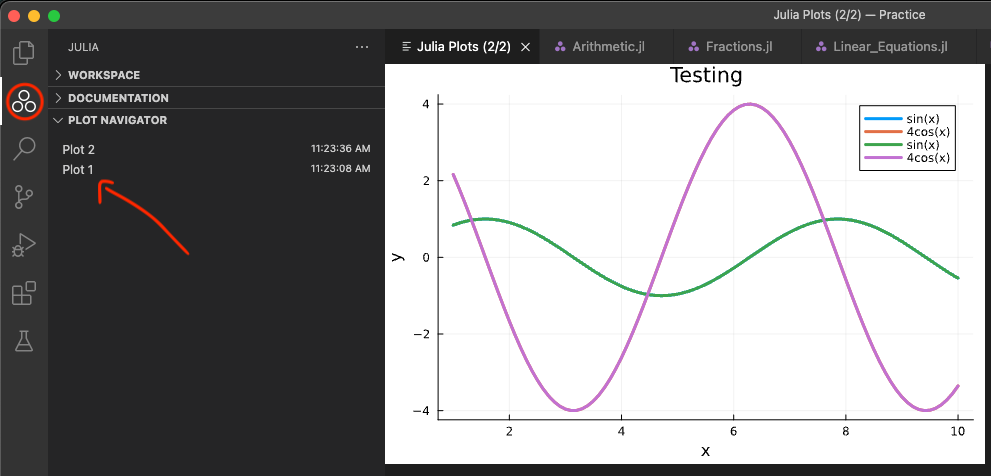
# Plots in VS Code
If you are using VS Code and Julia, each new plot you create will appear in the "Plot Navigator" on the Julia tab of your workspace.
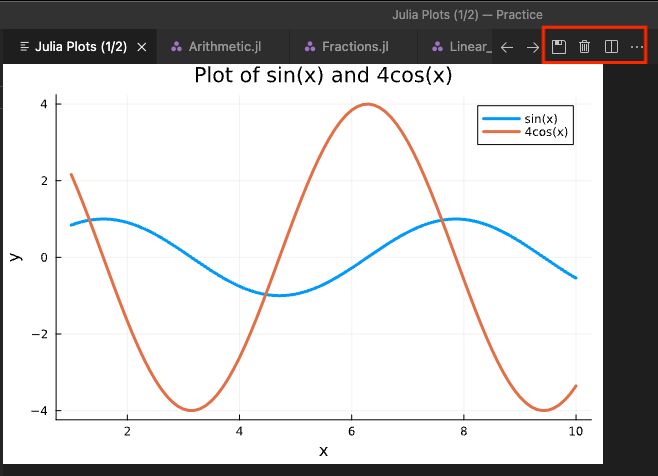
With a plot selected, you can choose to either save or delete it using the icons in the upper right portion of the screen.
# Conclusion
This is a brief overview of the most commonly used plotting functions and attributes in Julia using the Plots.jl library. For a more comprehensive overview, refer to the official [Plots documentation](https://docs.juliaplots.org/latest/) and explore the [Plots Tutorial](https://docs.juliaplots.org/latest/tutorial/#tutorial)
> If you’re new to Julia, check out the [Learn Julia crash course](https://chatcodetutor.gumroad.com/l/aosze) 🚀
[](https://chatcodetutor.gumroad.com/l/aosze)

Top comments (0)