Intro
In this blog post, we'll be talking about what exactly logging is, and how it differs from monitoring. We'll also cover some best practices that should be considered when logging from within your application. In addition, we'll cover the differences between structured and unstructured logs. And finally we'll set up a simple Phoenix application backed by Postgres and run Loki along side it to collect all of our application logs. Without further ado, let's dive right into things!
What is logging?
Logging is the practice of outputting and capturing information or events from your running applications. This information can be anything ranging from simple statements denoting which execution paths have been taken, to stack traces in the event of an error, to incoming request payloads. The goal is to capture information that can be leveraged when debugging application issues. In order to help categorize your various log messages, you can typically split up your log messages into four levels (these are the four levels available when using the Elixir Logger module [1]):
- Debug: Debug log messages are primary used as a development-time tool. These messages can help you during development so you have a in depth look at what your application is doing and what code paths are being executed. You can generally be more verbose with your debug log messages as this log level will be pruned from production logs.
- Info: Information level logs are typically used when you want to capture something that can be possibly used to help debug downstream errors. For example, capturing input parameters passed to an endpoint (with sensitive data scrubbed of course) can be useful if perhaps a 500 error occurs downstream. In short, informational messages are not used when something out of the ordinary happens, but can be instrumental in figuring out what caused something out of the ordinary to occur.
- Warning: A warning level log should be used when something bad happens, but there is a possibility of recovering. For example, if you are making calls to a 3rd party API and leverage some sort of retry logic, you can emit a warning message whenever an API call attempt fails.
- Error: An error level log should be used to denote that something bad has happened and there is no chance of recovering. This log message will generally be used to output some information that can help in debugging a customer impacting issue. To expand upon the previous example, you would use this log level when all retries have been exhausted and your 3rd party API is not responding.
Why do you need logging?
Logging is an important tool to have at your disposal as an engineer, as it allows you to root cause and resolve issues more quickly and with greater accuracy. By having a good logging solution at your disposal to search through logs and good logging coverage from within your application, you can reduce your MTTI and MTTR ("Mean Time to Identify" and "Mean Time to Repair" respectively [3]). Few things in business are as important as keeping your customers happy, and that means being able to identify issues and turn around a solution within a reasonable amount of time. This is exactly what an effective logging solution nets you. In fact, logging is so crucial to this process, that it is one of the Three Pillars of Observability 2. While I have not written anything about tracing (yet), I do have a series of posts related to monitoring and metrics collection in Elixir: Prometheus, PostGIS and Phoenix Part 1 and Prometheus, PostGIS and Phoenix Part 2. Feel free to check those out!
The obvious question that may come to mind is, how do all three of these differ and when should I use one over the other? In short:
- Logging: Logging deals with individual events and contains textual information associated with each of those events. For example, route
POST /userswas invoked with payload{"user_name": "Bob", "password": "[FILTERED]"} - Metrics: Metrics aim to aggregate events and measure specific data points over time. For example, how many requests per second is our API servicing during peak hours and how many of these requests are resulting 200s, 400s, and 500s.
- Tracing: Tracing is the process of aggregating and associating related events together. For example, if you are making an API call to a service, but that service needs to talk to 3 other services in order to fetch the information you need, you could leverage tracing to gain insight into the various service hops and their associated latencies all within the context of your original request. Tracing could also be localized to a single application and what are you tracing is the time across various function calls.
The next question that may come to mind is, do I need all of these things in place today in order to effectively debug issues? In an ideal world, your Engineering organization would have all three in place, and everything would be magical, and you would never actually need these tools since your code never has any bugs and there are never any network outages :). In the real world though, and from my experience, standing up these three pillars usually happens in phases. Logging being the first phase given that it has the lowest barrier to entry, and it is perhaps the most valuable (initially at least). By logging the various events occurring throughout the system along with relevant details, you can simulate or aggregate logs to produce metrics and tracing...but I would highly discourage against doing that given that it becomes very difficult to maintain that sort of implicit solution. Either way, logging will immediately prove beneficial given that you will be able to see errors, their frequency (via search), and some messages that may help in tracking down the root cause of problems.
Show me the code!
With all the theory and best practice out of the way, it is time to dive into the code and setup a Phoenix application alongside a self hosted logging solution. Our logging solution of choice for this tutorial will be Loki [4]. You could also use EFK, ELK, or Graylog to name a few. But I find those to be fairly heavy duty compared to Loki (not to turn this in a Vim versus Emacs style battle...they are all great tools and fit slightly different needs). In addition, we'll also be leveraging the Elixir library LoggerJSON [5] to create structured logs which will be captured by Loki. As a small tangent, logs can come in several different forms:
- Unstructured: With unstructured logs, the event messages appear as free-form text and are not structured in any particular way. For example, your log message could be something like:
/api/some-resource returned a 201 - Structured: With structured logging, your event messages are encapsulated within a standardized format. For example, your messages can be contained within a JSON blob along with some additional metadata
{"time": "2020-02-14 02:03:48.578284", "status": 500, "message": "Something bad happened!"}. - Binary: Binary log messages are not human readable like unstructured and structured logs. Instead, binary log messages are meant to be consumed by an application. For example in MySQL, binary logs can be used to keep track of all of the changes that have occurred to a database. This can later be used to update a database replica.
The application we will be working on for this tutorial is a basic used car search engine. We'll leverage LoggerJSON to generate structured logs from Ecto queries and Phoenix requests along with our own custom log statements. For the sake of simplicity, we'll seed our database with all of our dummy data, and will only have a single endpoint to power our search functionality. With that all being said, let's jump right into it!
Step 1: Create a new Phoenix project with required dependencies
To begin, let's start off by making sure we have the latest Phoenix project generator installed. Do that by running the following in the terminal:
$ mix archive.install hex phx_new 1.4.15
For this tutorial we'll also require Docker to be installed along with the Loki Logging driver. You can install Docker via https://www.docker.com/ or your package manager of choice. With Docker installed and running on your machine, run the following command to install the Loki Logging driver:
$ docker plugin install grafana/loki-docker-driver:latest --alias loki --grant-all-permissions
With this Docker logging driver installed, you will be able to ship logs directly from your Docker container to Loki without the use of Promtail [6] or Fluentd [7]. While you would not do this in production, this greatly simplifies the tutorial and let's us focus on the application logging aspect versus operationalizing this setup. If you would like to disable this plugin after completing the tutorial, simply run:
$ docker plugin disable loki
With our system dependencies satisfied, let's turn our focus to our Phoenix application. Since this is strictly a RESTful backend API, we don't require Webpack or any of the HTML related boilerplate. As a result, we'll create a new Phoenix project with the following command + flags and leave out the unused bits:
$ mix phx.new auto_finder --no-html --no-webpack --no-gettext
Let's also go ahead and add all of the Elixir dependencies that we will need for this tutorial. Open up your mix.exs file and make sure that you dependencies list looks like so:
defp deps do
  [
    {:phoenix, "~> 1.4.15"},
    {:phoenix_pubsub, "~> 1.1"},
    {:phoenix_ecto, "~> 4.0"},
    {:ecto_sql, "~> 3.3.4"},
    {:postgrex, ">= 0.0.0"},
    {:jason, "~> 1.0"},
    {:plug_cowboy, "~> 2.0"},
    {:logger_json, "~> 3.3.0"}
  ]
end
After updating the dependencies list, go ahead and run mix deps.get to fetch all the dependencies and to also update your mix.lock file (we'll need the lock file up to date for when we leverage it in our docker-compose.yml file). With all that done, let's turn our focus to our docker-compose.yml file and get our development stack up and running!
Step 2: Set up Docker Compose stack
In order to run our development stack, we'll require a few services to be running. Those services include:
- Loki: In short, Loki is a log aggregation database. Log messages are forwarded to Loki via your log collector of choice (Fluentd, Promtail, Logstash, etc) and are then stored for future querying. Loki operates in the same space as Elasticsearch, but makes some different design decisions. Where as Elasticsearch indexes everything that comes into it (roughly speaking), Loki instead leverages labels (much like Prometheus) to group similar log streams. When it comes to searching, Loki will then effectively Grep the relevant log streams using your labels to get you applicable results. While this may not seem as robust as Elasticsearch, in practice it means that Loki is far cheaper to run from an Operations perspective, and it is still more than quick enough (from my experience) given you are able to segment your search by time range and labels. Whether this tradeoff is applicable to your organization or project is something you'll have to investigate. Like most things in Engineering...it depends :D.
- Grafana: Grafana is an opensource tool which can be used to visualize your application/system metrics (these metrics are stored Prometheus for example). In addition to visualizing metrics, it also provides a fontend to view logs that are stored in your log aggregation database (in our case Loki is that database). I have an in depth tutorial series on setting up an Elixir application with Prometheus and Grafana if you are interested: Prometheus, PostGIS and Phoenix Part 1.
- Postgres: Postgres is an SQL database and honestly one of my favorite tools to leverage when developing backends. I rarely find myself needing another database unless I have specific needs like timeseries, full text search, graph data structures (and even a lot of these are often doable in Postgres these days via extensions and the rich standard library).
With our technical decisions explained, let's put together our docker-compose.yml file to bring up all of our applications:
version: '3.7'

services:
  auto_finder_app:
    image: elixir:1.10.2
    command: >
      /bin/sh -c 'apt-get update && apt-get install -y inotify-tools &&
      mix local.hex --force &&
      mix local.rebar --force &&
      mix deps.get &&
      mix ecto.setup &&
      mix phx.server'
    ports:
      - '4000:4000'
    depends_on:
      - loki
      - postgres
    working_dir: /app
    logging:
      driver: loki
      options:
        loki-url: 'http://loki:loki@localhost:3100/loki/api/v1/push'
    volumes:
      - ./config:/app/config:ro
      - ./lib:/app/lib:ro
      - ./priv:/app/priv:ro
      - ./mix.exs:/app/mix.exs:ro
      - ./mix.lock:/app/mix.lock:rw
      - elixir-deps:/app/deps/
      - elixir-build:/app/_build/

  postgres:
    image: postgres:12.2
    ports:
      - '5432:5432'
    volumes:
      - postgres-data:/var/lib/postgresql/data
    environment:
      POSTGRES_PASSWORD: postgres
      POSTGRES_USER: postgres

  loki:
    image: grafana/loki:master-f106c09
    volumes:
      - ./docker/loki/loki-config.yml:/etc/loki/loki-config.yml
      - loki-data-index:/loki-index
      - loki-data-chunks:/loki-chunks
    expose:
      - 3100
    ports:
      - '3100:3100'
    command: '-config.file=/etc/loki/loki-config.yml'

  grafana:
    image: grafana/grafana:6.6.2
    ports:
      - '3000:3000'
    volumes:
      - grafana-data:/var/lib/grafana
      - ./docker/grafana/:/etc/grafana/provisioning/

volumes:
  elixir-deps: {}
  elixir-build: {}
  postgres-data: {}
  loki-data-index: {}
  loki-data-chunks: {}
  grafana-data: {}
You'll notice that we reference the Loki logging driver in the auto_finder_app definition and also set the Loki URL to http://loki:loki@localhost:3100/loki/api/v1/push. The reason that we reference the Loki instance via localhost is that we are accessing it from the perspective of the host OS instead of as an adjacent container. With that said, the rest of the docker-compose.yml file is pretty standard and should be familiar if you are accustomed to Docker and Docker Compose. Let's also add the Grafana and Loki configuration files that are volume mounted. Create the file docker/grafana/datasources/datasource.yml with the following contents (this will automatically provision Loki as a datasource so that it is available in Grafana upon initialization):
# config file version
apiVersion: 1

datasources:
  - name: loki
    type: loki
    access: proxy
    url: http://loki:3100
    editable: false
With Grafana taken care of, let's create the file docker/loki/loki-config.yml which will be used to configure Loki. For detailed documentation on the Loki configuration options, see [8]
auth_enabled: false

server:
  http_listen_port: 3100

ingester:
  lifecycler:
    address: 127.0.0.1
    ring:
      kvstore:
        store: inmemory
      replication_factor: 1
    final_sleep: 0s
  chunk_idle_period: 5m
  chunk_retain_period: 30s

schema_config:
  configs:
    - from: 2018-04-15
      store: boltdb
      object_store: filesystem
      schema: v9
      index:
        prefix: index_
        period: 168h

storage_config:
  boltdb:
    directory: /loki-index

  filesystem:
    directory: /loki-chunks

limits_config:
  enforce_metric_name: false
  reject_old_samples: true
  reject_old_samples_max_age: 168h

chunk_store_config:
  max_look_back_period: 0

table_manager:
  chunk_tables_provisioning:
    inactive_read_throughput: 0
    inactive_write_throughput: 0
    provisioned_read_throughput: 0
    provisioned_write_throughput: 0
  index_tables_provisioning:
    inactive_read_throughput: 0
    inactive_write_throughput: 0
    provisioned_read_throughput: 0
    provisioned_write_throughput: 0
  retention_deletes_enabled: false
  retention_period: 0
As it stands now, we cannot yet start our application stack as our Phoenix app is not configured properly. We need to set the appropriate configurations to have the Phoenix app connect to Postgres and to also log via LoggerJSON. Let's tackle these things next!
Step 3: Configure application logging in Phoenix app
In order to have Elixir's Logger generate structured logs, we'll need to configure Logger to leverage the LoggerJSON library that we specified in our mix.exs file. We'll also want to disable the default Phoenix logger so that all of our logs are in the JSON format. Open up your config/config.exs file and make sure that it looks like the following:
use Mix.Config

config :auto_finder,
  ecto_repos: [AutoFinder.Repo]

# Configures the endpoint
config :auto_finder, AutoFinderWeb.Endpoint,
  url: [host: "localhost"],
  secret_key_base: "<YOU_SECRET_KEY_BASE_GOES_HERE>",
  render_errors: [view: AutoFinderWeb.ErrorView, accepts: ~w(json)],
  pubsub: [name: AutoFinder.PubSub, adapter: Phoenix.PubSub.PG2],
  live_view: [signing_salt: "60QXfDxg"]

# Configures Elixir's Logger
config :logger, backends: [LoggerJSON]
config :auto_finder, AutoFinder.Repo, loggers: [{LoggerJSON.Ecto, :log, [:info]}]

config :logger_json, :backend,
  metadata: [:file, :line, :function, :module, :application, :httpRequest, :query],
  formatter: AutoFinder.LoggerFormatter

# Use Jason for JSON parsing in Phoenix
config :phoenix, :json_library, Jason
config :phoenix, :logger, false

# Import environment specific config. This must remain at the bottom
# of this file so it overrides the configuration defined above.
import_config "#{Mix.env()}.exs"
We'll also want to update our config/dev.exs file so that we are able to access our instance of Postgres running from within Docker. Update the AutoFinder.Repo configuration section so that it looks like the following:
# Configure your database
config :auto_finder, AutoFinder.Repo,
  username: "postgres",
  password: "postgres",
  database: "auto_finder_dev",
  hostname: "postgres",
  show_sensitive_data_on_connection_error: true,
  pool_size: 10
You'll notice that we reference a formatter within the AutoFinder namespace when configuring :logger_json in our config/config.exs file. By default, the LoggerJSON library comes with a GCP (Google Cloud Platform) specific formatter, so we will create our own formatter to keep our logs more generic. Our log formatter is almost an identical clone of the default LoggerJSON formatter [9], but with all the GCP specific bits removed. Below is the formatter which you should put in lib/log_formatter.ex:
defmodule AutoFinder.LoggerFormatter do
  @moduledoc """
  Custom Formatter
  """
  import Jason.Helpers, only: [json_map: 1]

  @behaviour LoggerJSON.Formatter

  @processed_metadata_keys ~w[pid file line function module application]a

  @severity_levels [
    debug: "DEBUG",
    info: "INFO",
    warning: "WARNING",
    warn: "WARNING",
    error: "ERROR"
  ]

  for {level, gcp_level} <- @severity_levels do
    def format_event(unquote(level), msg, ts, md, md_keys) do
      Map.merge(
        %{
          time: format_timestamp(ts),
          severity: unquote(gcp_level),
          message: IO.iodata_to_binary(msg)
        },
        format_metadata(md, md_keys)
      )
    end
  end

  def format_event(_level, msg, ts, md, md_keys) do
    Map.merge(
      %{
        time: format_timestamp(ts),
        severity: "DEFAULT",
        message: IO.iodata_to_binary(msg)
      },
      format_metadata(md, md_keys)
    )
  end

  defp format_metadata(md, md_keys) do
    LoggerJSON.take_metadata(md, md_keys, @processed_metadata_keys)
    |> maybe_put(:error, format_process_crash(md))
  end

  defp maybe_put(map, _key, nil), do: map
  defp maybe_put(map, key, value), do: Map.put(map, key, value)

  defp format_process_crash(md) do
    if crash_reason = Keyword.get(md, :crash_reason) do
      initial_call = Keyword.get(md, :initial_call)

      json_map(
        initial_call: format_initial_call(initial_call),
        reason: format_crash_reason(crash_reason)
      )
    end
  end

  defp format_initial_call(nil), do: nil

  defp format_initial_call({module, function, arity}),
    do: "#{module}.#{function}/#{arity}"

  defp format_crash_reason({:throw, reason}) do
    Exception.format(:throw, reason)
  end

  defp format_crash_reason({:exit, reason}) do
    Exception.format(:exit, reason)
  end

  defp format_crash_reason({%{} = exception, stacktrace}) do
    Exception.format(:error, exception, stacktrace)
  end

  defp format_crash_reason(other) do
    inspect(other)
  end

  # RFC3339 UTC "Zulu" format
  defp format_timestamp({date, time}) do
    [format_date(date), ?T, format_time(time), ?Z]
    |> IO.iodata_to_binary()
  end

  defp format_time({hh, mi, ss, ms}) do
    [pad2(hh), ?:, pad2(mi), ?:, pad2(ss), ?., pad3(ms)]
  end

  defp format_date({yy, mm, dd}) do
    [Integer.to_string(yy), ?-, pad2(mm), ?-, pad2(dd)]
  end

  defp pad3(int) when int < 10, do: [?0, ?0, Integer.to_string(int)]
  defp pad3(int) when int < 100, do: [?0, Integer.to_string(int)]
  defp pad3(int), do: Integer.to_string(int)

  defp pad2(int) when int < 10, do: [?0, Integer.to_string(int)]
  defp pad2(int), do: Integer.to_string(int)
end
Before getting to our business logic related code, we have two additional changes that we need to make. One of those being that we need to add a Telemtry handler for Ecto events so that we can log information when queries are executed against Postgres. The other being that we need to edit the plug pipeline in our endpoint.ex file so that we can trigger the LoggerJSON plug when requests are serviced. Let's first open up our application.ex file and add the following snippet within our start/2 callback.
def start(_type, _args) do
  children = [
    ...
  ]

  # Attach Telemetry handler for Ecto events
  :ok =
    :telemetry.attach(
      "logger-json-ecto",
      [:auto_finder, :repo, :query],
      &LoggerJSON.Ecto.telemetry_logging_handler/4,
      :info
    )

  ...
end
Afterwards, open up the lib/auto_finder_web/endpoint.ex file and add a call to the LoggerJSON plug by adding plug LoggerJSON.Plug in the plug chain. I usually add the logger plug before the plug Plug.Static call.
With all that in place, our foundation work is complete and it is now time to turn our attention to our business logic.
Step 4: Implementing our business logic
The first thing we'll need to do is create a migration for our used cars table. Run the following command to create an Ecto migration:
$ mix ecto.gen.migration used_cars
After running that command, open up the generated file and add the following contents (if you feel ambitious, you can add indices for the various searchable fields :)):
defmodule AutoFinder.Repo.Migrations.UsedCars do
  use Ecto.Migration

  def change do
    create table(:used_cars) do
      add :make, :string
      add :model, :string
      add :year, :integer
      add :mileage, :integer
      add :price, :integer

      timestamps()
    end
  end
end
With our migration in place, let's also update our priv/repo/seeds.exs script so that we can seed our database with dummy data:
alias AutoFinder.{Repo, UsedCars.UsedCar}

car_selection = [
  {"Acura", ~w(ILX TLX RLX RDX MDX NSX), 15_000..35_000},
  {"Honda", ~w(Accord Civic CR-V Odyssey Passport), 10_000..25_000},
  {"Nissan", ~w(GT-R 370Z Titan Leaf Sentra), 25_000..50_000},
  {"Mazda", ~w(MX-5 CX-3 CX5 CX-9), 15_000..25_000},
  {"Chevrolet", ~w(Camaro Corvette Colorado Silverado), 25_000..50_000},
  {"Ford", ~w(Escape Explorer Mustang Focus), 15_000..25_000},
  {"Audi", ~w(A4 Q3 A6 Q7 R8 S3 S4 RS5), 20_000..50_000},
  {"BMW", ~w(M2 M3 M5 X4 X7), 20_000..50_000},
  {"Subaru", ~w(Impreza Legacy Forester BRZ WRX), 15_000..25_000},
  {"Porsche", ~w(Taycan Panamera MAcan Cayenne Carrera Cayman), 40_000..70_000},
  {"Ferrari", ~w(812 F8 488 GTC4 Portofino), 150_000..250_000}
]

1..1_000
|> Enum.each(fn _ ->
  {make, models, price_range} = Enum.random(car_selection)
  model = Enum.random(models)
  price = Enum.random(price_range)
  year = Enum.random(2015..2020)
  mileage = Enum.random(10_000..60_000)

  %UsedCar{}
  |> UsedCar.changeset(%{make: make, model: model, price: price, year: year, mileage: mileage})
  |> Repo.insert!()
end)
You probably noticed that we made a call to a changeset and referenced a struct that we have not yet implemented. Let's go ahead and add those now. Create a file lib/auto_finder/used_cars/used_car.ex with the following contents:
defmodule AutoFinder.UsedCars.UsedCar do
  use Ecto.Schema

  import Ecto.Changeset

  @fields ~w(make model year mileage price)a

  @derive {Jason.Encoder, only: @fields}

  schema "used_cars" do
    field :make, :string
    field :model, :string
    field :year, :integer
    field :mileage, :integer
    field :price, :integer

    timestamps()
  end

  def changeset(used_car, attrs \\ %{}) do
    used_car
    |> cast(attrs, @fields)
    |> validate_required(@fields)
  end
end
We'll also want to create a module that will act as the entry point into our "used car" context. Let's create a file lib/auto_finder/used_cars/used_cars.ex with the following contents:
defmodule AutoFinder.UsedCars do
  import Ecto.Query

  alias AutoFinder.{Repo, UsedCars.UsedCar}

  def get_used_cars(query_params) do
    base_query = from(used_car in UsedCar)

    query_params
    |> Enum.reduce(base_query, &handle_query_param/2)
    |> Repo.all()
  end

  defp handle_query_param({"make", make}, acc_query) do
    from used_car in acc_query, where: ilike(used_car.make, ^make)
  end

  defp handle_query_param({"model", model}, acc_query) do
    from used_car in acc_query, where: ilike(used_car.model, ^model)
  end

  defp handle_query_param({"min_year", min_year}, acc_query) do
    from used_car in acc_query, where: used_car.year >= ^min_year
  end

  defp handle_query_param({"max_price", max_price}, acc_query) do
    from used_car in acc_query, where: used_car.price <= ^max_price
  end

  defp handle_query_param({"max_mileage", max_mileage}, acc_query) do
    from used_car in acc_query, where: used_car.mileage <= ^max_mileage
  end
end
Our get_used_cars/1 function will be called from our controller and will be used to dynamically build the user's query. The function reduces on all of the user's search options, appending to the query additional where clauses. Once the query is built, a call to Repo.all/1 is made to fetch all the used cars that match the users search terms. As a side note, I find this pattern of dynamically building queries very flexible, easy to test, and clean from a readers perspective :).
With our context function in place, let's create a new controller at lib/auto_finder_web/controllers/used_car_controller.ex and add the following contents (for the purposes of this tutorial we'll omit input validation...but you should always do that in production):
defmodule AutoFinderWeb.UsedCarController do
  use AutoFinderWeb, :controller

  alias AutoFinder.UsedCars

  require Logger

  def index(conn, params) do
    results = UsedCars.get_used_cars(params)

    if results == [] do
      Logger.info(
        "Search #{inspect(params)} yielded no results...perhaps we should suggest something similar"
      )
    else
      Logger.info("Search #{inspect(params)} yielded some results...customer should be happy")
    end

    json(conn, results)
  end
end
You'll notice that we added some log statements to our controller to get a sense for how people are using our API and to have something that simulates the real world show up in Grafana once we make some requests against our API. With our controller in place, all that is left is to update our router.ex file so that we can hit our controller. Open up lib/auto_finder_web/router.ex and ensure that it looks like the following:
defmodule AutoFinderWeb.Router do
  use AutoFinderWeb, :router

  pipeline :api do
    plug :accepts, ["json"]
  end

  scope "/api", AutoFinderWeb do
    pipe_through :api

    get "/used_cars", UsedCarController, :index
  end
end
Step 5: Taking our application stack for a test drive
With all this in place, we are ready to fire up our Docker Compose stack and see it all in action. To recap a bit, we have configured LoggerJSON to capture logs from Ecto via Telemetry, Phoenix, and our own custom log statements. We have a Phoenix app that exposes a single endpoint that is used to search used cars in our database that is seeded with sample entries. And we have all of our stdout/stderr logs being forwarded to Loki via the Docker logging driver. Those logs will be surfaced via Grafana which is also up and running within our development stack. That being said, let's fire up the stack by running:
$ docker-compose up
In order to exercise the API a bit, you can run the following cURL commands and get some sample data as you can tell...I'm in the market for a Ferrari :D (I wish):
$ curl 'http://localhost:4000/api/used_cars?make=ferrari'
[{"make":"Ferrari","model":"812","year":2017,"mileage":46945,"price":244424}, ...

$ curl 'http://localhost:4000/api/used_cars?make=ferrari&model=F8&max_price=155000'
[{"make":"Ferrari","model":"F8","year":2016,"mileage":56021,"price":152403}, ...

$ curl 'http://localhost:4000/api/used_cars?make=ferrari&model=Portofino&min_year=2020'
[{"make":"Ferrari","model":"Portofino","year":2020,"mileage":21333,"price":169790}, ...

$ curl 'http://localhost:4000/api/used_cars?make=invalid_car_make'
[]
With some queries having been made to our backend API, we should be able to open up Grafana and see some logs regarding these queries. Navigate to http://localhost:3000/explore (the default username and password for Grafana are both admin). From the Log labels drop down list select compose_service > auto_finder_app. If everything has been set up properly, you should see something like the following:
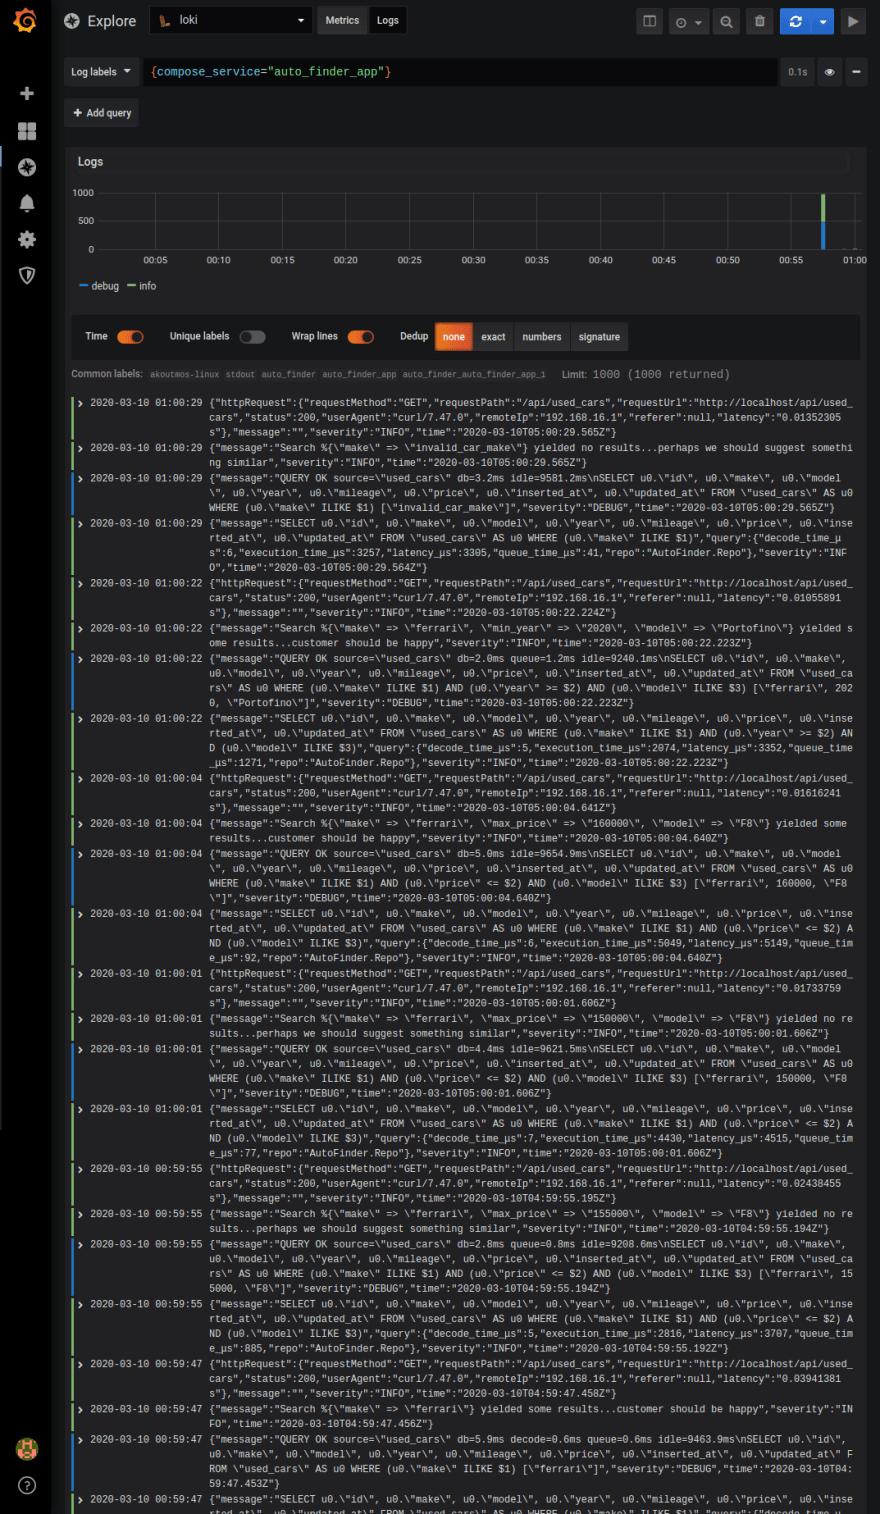
Feel free to play around with the Explore section of Grafana. You can live tail logs, search [10], and expand log entries to see all of the details regarding the message. Luckily, Grafana and Loki are smart enough to break up the JSON messages so that it is easier to consume to structured log entries as seen below (one of the benefits of structured logging ;)):
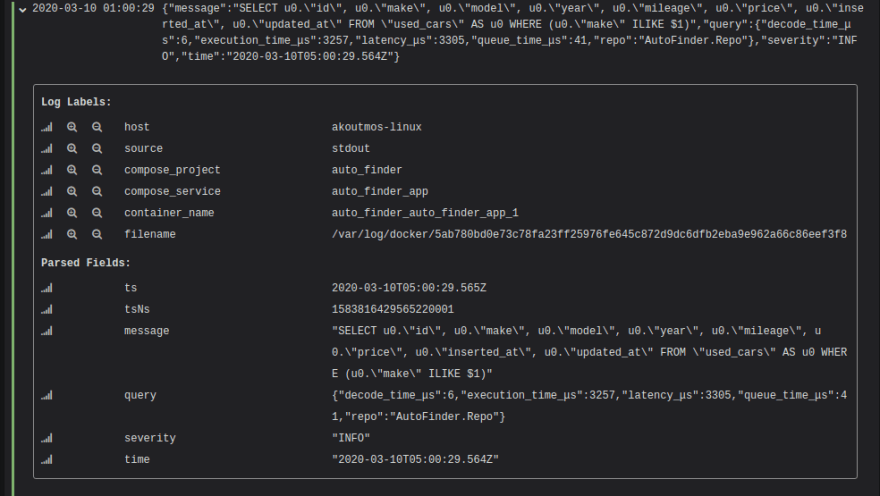
As we can see, it if very easy to extract the detailed information regarding the SQL query that Ecto generated including the time it took to fetch the data from the database. As a bonus for making it through the entire tutorial, below is a screen capture of Grafana while tailing the logs from the container:

Closing thoughts
Well done and thanks for sticking with me to the end! We covered quite a lot of ground and hopefully you picked up a couple of cool tips and tricks along the way. To recap, we created a simple Phoenix backend API backed by Postgres for the purposes of searching for used cars. Our API makes use of LoggerJSON to create Ecto, Phoenix, and application structured logs. The JSON structured logs are forwarded to Loki via Loki's Docker logging driver. Our logs that are stored in Loki are then searchable via Grafana. With all this in place, we have one of our pillars of observability set up and can gain valuable insight into how our application is behaving.
While this worked out great for a local development environment, I would suggest looking into Promtail [6] or Fluentd [7] when running Loki (or any kind of log aggregation tool for that matter) in order to ship your logs out of your applications in a production setting. In regards to the Loki logging driver, If you would like to play around with the settings for it, or uninstall it reference the documentation [11].
Feel free to leave comments or feedback or even what you would like to see in the next tutorial. Till next time!
Additional Resources
Below are some additional resources if you would like to deep dive into any of the topics covered in the post.
- [1] https://hexdocs.pm/logger/Logger.html#module-levels
- [2] https://www.oreilly.com/library/view/distributed-systems-observability/9781492033431/ch04.html
- [3] https://www.sumologic.com/mttr-mtti/
- [4] https://github.com/grafana/loki
- [5] https://github.com/Nebo15/logger_json
- [6] https://github.com/grafana/loki/blob/master/docs/clients/promtail/configuration.md
- [7] https://github.com/grafana/loki/blob/master/docs/clients/fluentd/README.md
- [8] https://github.com/grafana/loki/tree/master/docs/configuration
- [9] https://github.com/Nebo15/logger_json/blob/master/lib/logger_json/formatters/google_cloud_logger.ex
- [10] https://grafana.com/docs/grafana/latest/features/datasources/loki/#search-expression
- [11] https://github.com/grafana/loki/tree/master/cmd/docker-driver

Top comments (0)