Fast version's threshold
I experimented with threshold of the fast version of the algorithm:

This picture shows F score on testing dataset, X axis shows the number of the video, the Y axis - F score on this video. Lines represents different versions of the algorithm according to the legend.
It can be seen that increasing the threshold value improves the F score of the algorithm and does not affect the processing speed.
Here is the table of mean F score on datasets for different versions:
| Version | F score on BBC Planet Earth | F score on open source videos |
|---|---|---|
| Fast with thr = 12 (current) | 0.5939 | 0.6011 |
| Fast with thr = 15 | 0.6490 | 0.6361 |
| Fast with thr = 16 | 0.6961 | 0.6375 |
| Fast with thr = 17 | 0.7393 | 0.6623 |
| Fast with thr = 18 | 0.7441 | 0.6652 |
| Fast with thr = 20 | 0.7795 | 0.6244 |
| Slow | 0.7024 | 0.5628 |
| Slow improved | 0.8081 | 0.6515 |
I chose optimal value of the threshold as 18.
Slow version's threshold
After experiments, the threshold for slow version was reduced by a factor of 2.2. Here you can see charts of performance (F score, precision and recall) of the algorith depending on the threshold reduction factor. These results were obtained with open-sourced videos from youtube.com and vimeo.com
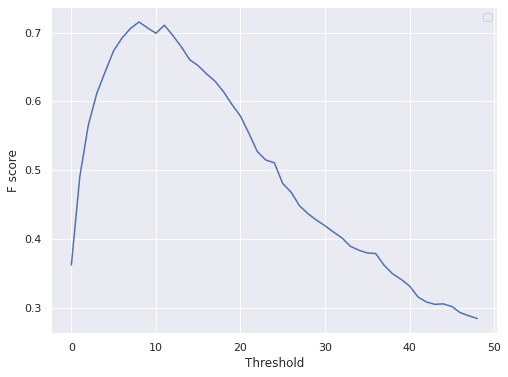


Here also the results on BBC Planet Earth datset:


And precision-recall curve:

Improvement of the metric
To make the peaks of the metric more distinguishable for the threshold, I applied numerical differentiation to its values. Here is the example of the outcome on one of the videos:
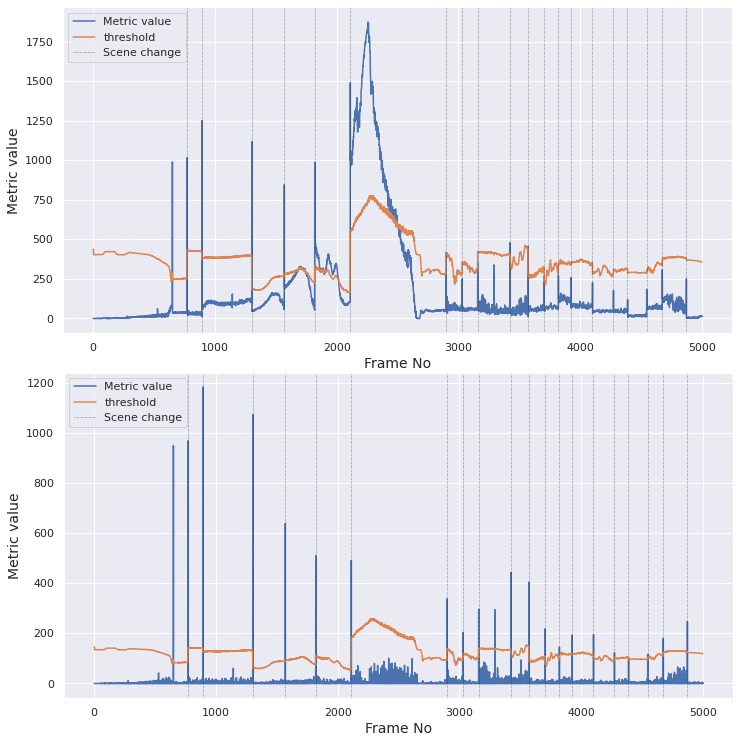
The top picture shows original metric values, the bottom one shows metric after improvement.
You can see that the peaks with the scene changes became more distinct, so the threshold is easier to tune.

Top comments (0)