
Cover Photo by Fotis Fotopoulos on Unsplash
What is Profiling?
'Profiling' in programming refers to finding and upgrading those resources that require modification. The resources responsible for enhancing reaction time, response time, and cache time are referred to as modifications. So, we're studying the behavior and making a judgment based on it.
The main goal of profiling is to reduce CPU resource use once it's been found, so we can improve the program's response time and make it faster than before.
Ideally, we must only pay for the time we use the resources, as we know from cloud architecture. As a result, if we consume resources for a shorter period of time, we pay less. Thus, continuous profiling, that is, profiling during production, leads to cost optimization.
How is Profiling Done?
Sometimes, it is critical to track how long a code takes to execute after implementing optimization techniques. To measure the time and memory used to execute a code, we use a time profiler and the memory profiler.
Time Profiler
In Python, we have inbuilt time profilers---"time" and " timeit"---which can measure the time taken to execute a code.
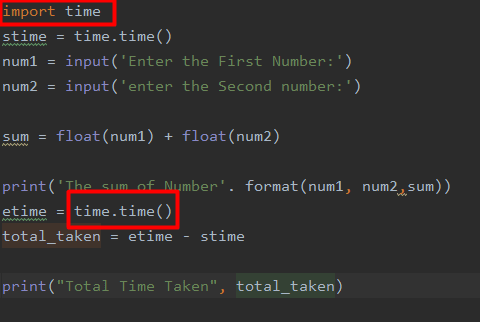
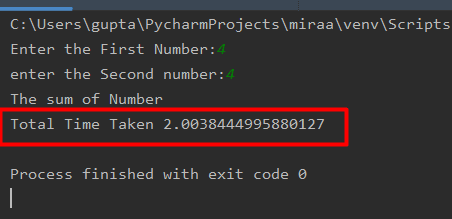
a. Time.time(): We are going to use the time.time() function of Python. This measures the time that a specific function or program takes to execute. It shows us whether the complete code was slow in the execution or if a particular program was slow. Sometimes, there might be a problem that is causing the code to execute slowly. There might be a situation in which the CPU is busy running or processing other instructions, so the execution of the Python code becomes slow. In such cases, the wrong time will be returned.
b. Timeit.repeat(): This function executes the same code multiple times and shows up the average time derived from all the executions. Since the code is getting executed numerous times, it provides a more accurate estimate of the execution time.
c. Time.clock(): If you want to know the time that the CPU takes to execute the code, you can use this function. It shows the total execution time that a CPU takes in processing the statements.
Memory Profiler
Memory profilers are used to calculate the memory usage of each and every line and the functions used in the Python program. It helps in optimizing the code, so it takes less memory in the execution.
It results in lower power consumption and hardware damage.
It allows users to run small instances also.
It allows for extra capacity in the event of a traffic jam.

To get an output from the memory_profiler, we have to run a command like this in the terminal:
Python --m memory_profiler <name of snippet>
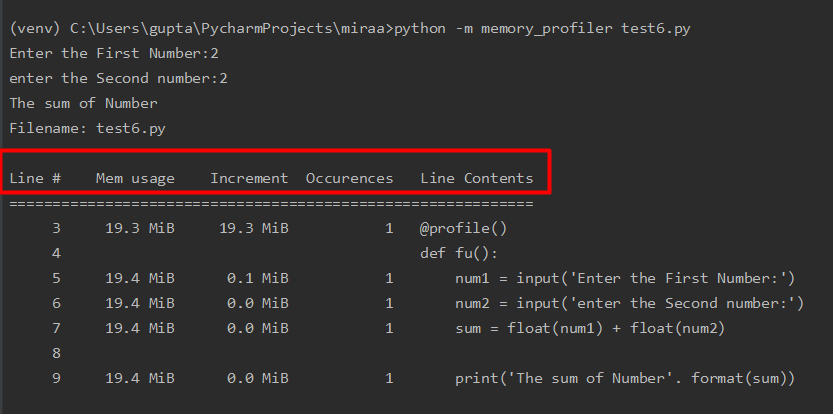
Every column in the output has its own significance.
The first column represents lines.
The second column represents the memory usage.
The third column represents the difference in memory between the current line and the previous line.
The fourth column represents how many times it occurred.
The last column represents the printed contents.
Why Profiling is Necessary
Profiling is critical for cost optimization and delivering a faster response time to users.
Whenever we run a code or program, whether on the cloud or a server on your premises, it is critical to optimize it since functions utilize a lot of memory. Not doing so in the cloud environment might cost you money because you will be using many resources, and the more resources you use, the more you will have to pay. And not doing so in the case of a local server may cause disruptions in other applications as they will have fewer resources for their execution.
How to Profile Python Code in Production
Until now, we have seen so many inbuilt profilers in Python, but every profiler has its own specifications---some work on a time basis and some on a memory basis. If we use them continuously, they will take up a lot of resources. Thus, it is not possible to run them continuously.
To remove this obstacle, we can use software like gProfiler. It doesn't block up all your resources because it runs in the background, using very few resources. It provides extensive details on its dashboard, like memory used and CPU stats, and it supports a variety of languages like Java, GO, and others.
Even if you run a profiler using built-in python functions, you still need to make changes in the code. This makes the code more complicated, making it harder for the profiler to understand at times. Thus, it uses a lot of memory and resources and shows significantly fewer stats. In such cases as well, gProfiler helps you because it is able to perform continuous profiling and provide a lot of stats about the program using fewer resources.
Let's understand how gProfiler works.
To use the gProfiler while in production, we can install it on the production server. For this, create an account so you can get an API key that will bind to your server.
After creating an account, create a service name that you want to monitor, such as client website, internal website, etc.
Run these commands to download and install gProfiler on your server.
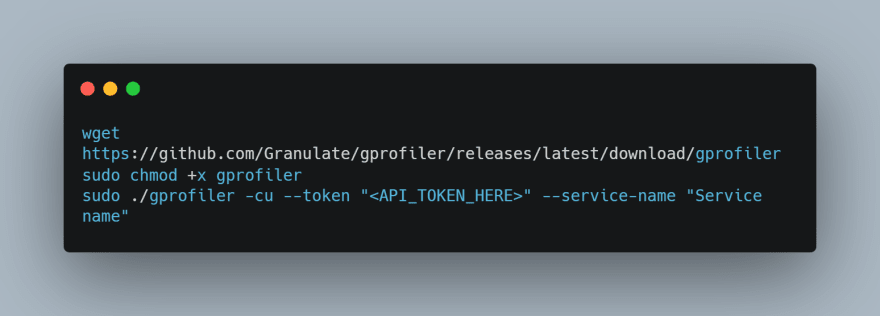
Once gProfiler has been installed, it will start running as soon as you run the last command.
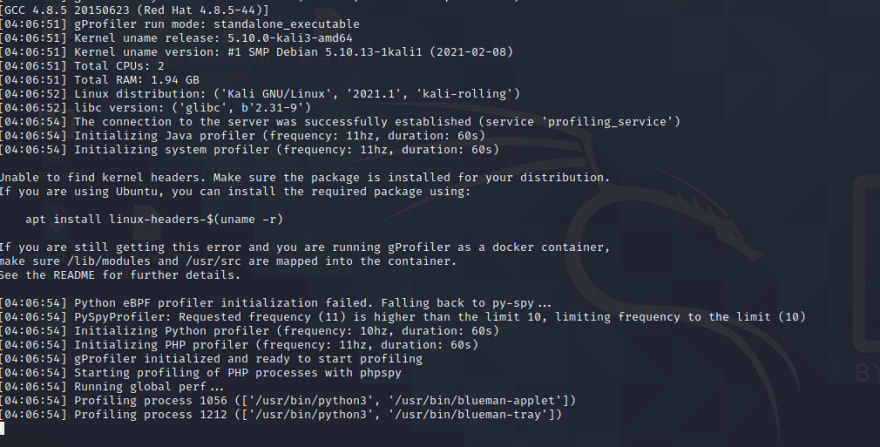
As soon as you run anything on the system, it will start profiling that code. And since it is a plug-and-play software, it needs no code modifications and provides seamless production profiling.
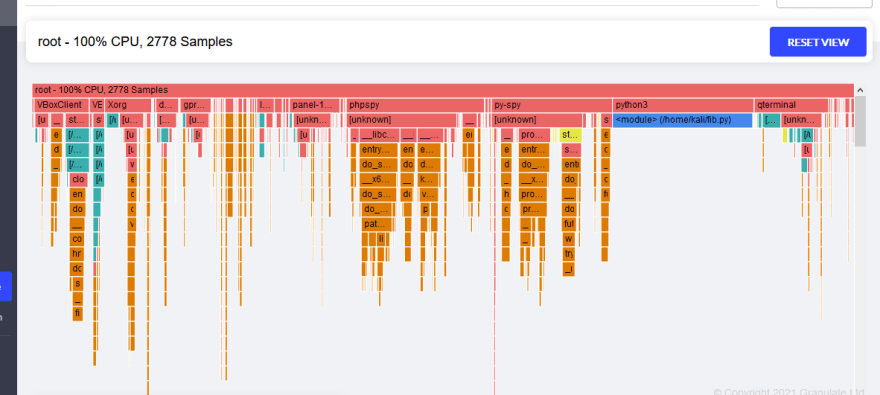
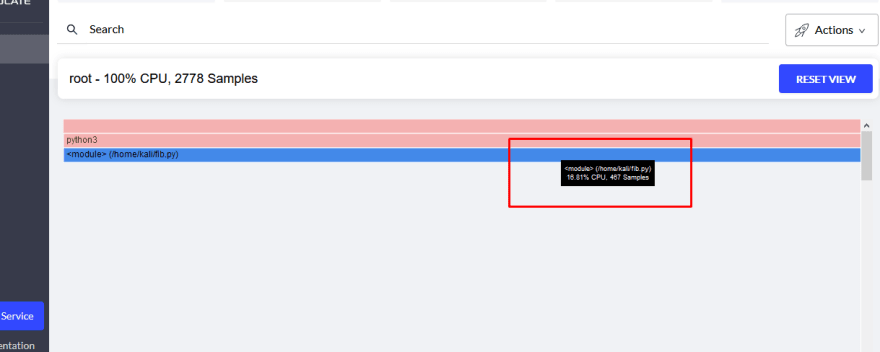
And you will have all the information on your dashboard.
Conclusion
We have discussed how profiling codes on Python can be done using inbuilt functions. We also discussed their drawbacks and limitations---they consume too many resources, have limited capabilities, and cannot be run during production. We also discussed gProfiler as a tool that provides a better profiling solution and overcomes the limitations of the in-built functions.

Top comments (0)