The past year has been an interesting one, as people around the world worked from home and completed classes and degrees online. We can finally see the light at the end of the tunnel, mostly due to the incredible work that pharmaceutical companies around the world completed over the last year. Creating a vaccine for COVID-19 was a massive undertaking, but so was quickly developing a plan to manufacture and distribute the vaccine. Using SAS Viya's forecasting platform, we can use machine learning to accurately predict a state's future total vaccinations, allowing a state to make better decisions regarding reopening plans.
We will create our application in three steps:
- Create a basic webservice using FastAPI and Python to generate and return a model.
- Use the SWAT Python package to leverage the power of SAS Viya and create a forecasting model given state vaccination data. repo
- Create a frontend website so users can interact with the website. repo
For this project, we will use the USA COVID-19 Vaccinations dataset from Kaggle.
Here is a sample of the data:
| date | location | total_vaccinations | total_distributed | people_vaccinated | people_fully_vaccinated_per_hundred | total_vaccinations_per_hundred | people_fully_vaccinated | people_vaccinated_per_hundred | distributed_per_hundred | daily_vaccinations_raw | daily_vaccinations | daily_vaccinations_per_million | share_doses_used |
|---|---|---|---|---|---|---|---|---|---|---|---|---|---|
| 2021-01-12 | Alabama | 78134.0 | 377025.0 | 70861.0 | 0.15 | 1.59 | 7270.0 | 1.45 | 7.69 | 0.207 | |||
| 2021-01-13 | Alabama | 84040.0 | 378975.0 | 74792.0 | 0.19 | 1.71 | 9245.0 | 1.53 | 7.73 | 5906.0 | 5906.0 | 1205.0 | 0.222 |
| 2021-01-14 | Alabama | 92300.0 | 435350.0 | 80480.0 | 1.88 | 1.64 | 8.88 | 8260.0 | 7083.0 | 1445.0 | 0.212 | ||
| 2021-01-15 | Alabama | 100567.0 | 444650.0 | 86956.0 | 0.28 | 2.05 | 13488.0 | 1.77 | 9.07 | 8267.0 | 7478.0 | 1525.0 | 0.226 |
1: Create a FastAPI Webservice
Let's go ahead and create a new boilerplate FastAPI project to start our webservice.
# All the packages we will eventually need for our project
from datetime import datetime
from fastapi.datastructures import UploadFile
from fastapi.param_functions import File
from numpy import str_
from swat import *
import pandas as pd
from matplotlib import pyplot
from fastapi import FastAPI, Form, File, UploadFile, HTTPException
from fastapi.responses import FileResponse
import base64

origins = [
    "http://localhost:3000",
]

app.add_middleware(
    CORSMiddleware,
    allow_origins=origins,
    allow_credentials=True,
    allow_methods=["*"],
    allow_headers=["*"],
)

@app.post('/')
async def hello_world():
    return 'Hello World'
We can now run our new API by running uvicorn main:app --reload in our terminal. To learn more about FastAPI, click here.
Great, now we should see a page in our browser that displays the text "Hello World".
Let's add another endpoint that we will use to accept the user's username, password, and uploaded dataset. The API will then send this data to the CAS server for processing (step 2).
@app.post('/forecast')
async def forecast(user: str = Form(...), password: str = Form(...), file: UploadFile = File(...)):
    return True
Here, we have created a new HTTP POST endpoint, where the user will submit a username, password, and file as form data.
2: Use SAS Viya to Create a Forecasting Model
Now, let's connect to SAS Viya using the SWAT package. This is where we get to the cool stuff.
We'll start by defining a function that will connect to CAS, Viya's Cloud Analytics Service, which will do all of the heavy lifting on the data for us.
async def connect_to_cas(user, password):
    cas_server = 'YOUR_CAS_SERVER_URL'
    try:
        s = CAS(cas_server, '8777', user, password)
    except:
        raise HTTPException(401)
    return s
Now we're connected to SAS's cloud analytics service. Let's first load our data into a pandas dataframe. If you recall, we passed a CSV file into our forecast function named 'file'. We will open this file and save it to our local drive.
async def forecast(user: str = Form(...), password: str = Form(...), file: UploadFile = File(...)):
    str_file = file.file.read()
    f = open('in.csv', 'wb')
    f.write(str_file)
    ...
From here, we can load our new data into a pandas dataframe.
...
df = pd.read_csv('in.csv')
...
It is important to recognize that there are many different date formats when it comes to computers. That is why it will be important for us to use a standard format; in this case we will use the CAS date format. We can convert the dates in our dataset to CAS dates using the following code.
...
# Convert string to python date obj
python_dates = pd.to_datetime(df['date'], format='%Y-%m-%d')
# Create list of new CAS dates from
# Python dates
new_dates = [cas.utils.datetime.python2cas_date(python_dates.iloc[i]) for i in range(len(python_dates))]
# Add CAS dates to our pandas dataframe
df.insert(1, 'dates_cas', new_dates)
...
The dates from our dataset are now in a format that CAS can understand. It's now time to upload our dataframe to CAS and apply the forecast action on it.
Documentation for the forecast action can be found here. Information on using the forecasting action with SWAT can be found here.
| parameter | explanation |
|---|---|
| table | uploaded table to apply forecast to |
| timeid | the name of the column with the dates |
| interval | interval of the dates (month, day, year, etc.) |
| tStart | start date for the data in your uploaded table |
| tEnd | end date for the data in your uploaded table |
| dependents | the dependent variable for your forecast in this case, it will be the 'people_vaccinated' column |
| forout | output table where the predictions for 'people_vaccinated' will be stored |
| lead | amount of time we are forecasting |
...
# Connect to the server
s = await connect_to_cas(user, password)
# Uploading our dataframe to the CAS server
resp = s.upload(
    df,
    casOut={'name': 'covid_vaccines_upload', 'caslib': 'casuser', 'replace': 'true'}
)

# Add the timedata action set so that we can perform a forecast
s.loadActionSet('timedata')

# Perform that forecast using our uploaded table
# and spit out the forecast for the
# next 30 days to a table named covid_vaccines.
s.timedata.forecast(
    table={'name':'covid_vaccines_upload', 'caslib': 'casuser'},
    timeid={'name':'dates_cas'},
    interval='day',
    tStart='2021-01-12',
    tEnd='2021-05-23',
    dependents=[{'accumulate':'SUM','name':'people_vaccinated'}],
    forout={'name': 'covid_vaccines', 'caslib': 'casuser', 'replace': 'true'}
    lead=30
)

# Retreive the forecasted data from the
# CAS server and create a dataframe from it
forecasted_data = s.CASTable('covid_vaccines',caslib='casuser').to_frame().drop(columns='_NAME_')
...
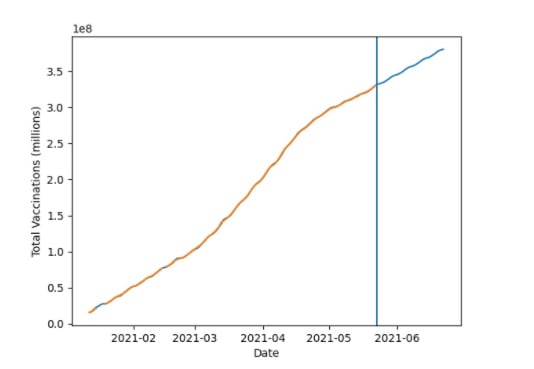
From here we can generate a plot and return the forecasted data to the user.
...
predictions_after = datetime.strptime(df.sort_values(by='date').iloc[-1]['date'], '%Y-%m-%d')
pyplot.plot(forecasted_data['dates_cas'], forecasted_data['PREDICT'])
pyplot.plot(forecasted_data['dates_cas'], forecasted_data['ACTUAL'])
pyplot.axvline(predictions_after)
pyplot.xlabel('Date')
pyplot.ylabel('Total Vaccinations (millions)')
pyplot.savefig('out.jpg', type='jpg')

return {'plot': base64.b64encode(open('out.jpg', 'rb').read()), 'tbl': forecasted_data.to_html()}
...
Our completed function will look something like this:
@app.post('/forecast')
async def forecast(user: str = Form(...), password: str = Form(...), file: UploadFile = File(...)):
    str_file = file.file.read()
    f = open('in.csv', 'wb')
    f.write(str_file)
    # df = pd.DataFrame([x.split(',') for x in str_file.split('\n')])
    df = pd.read_csv('in.csv')
    python_dates = pd.to_datetime(df['date'], format='%Y-%m-%d')
    new_dates= [cas.utils.datetime.python2cas_date(python_dates.iloc[i]) for i in range(len(python_dates))]
    df.insert(1, 'dates_cas', new_dates)

    s = await connect_to_cas(user, password)

    resp = s.upload(df, casOut={'name': 'covid_vaccines_upload', 'caslib': 'casuser', 'replace': 'true'})

    s.loadActionSet('timedata')

    s.timedata.forecast(
        table={'name':'covid_vaccines_upload', 'caslib': 'casuser'},
        timeid={'name':'dates_cas'},
        interval='day',
        tStart='2021-01-12',
        tEnd='2021-05-23',
        dependents=[{'accumulate':'SUM','name':'people_vaccinated'}],
        forout={'name': 'covid_vaccines', 'caslib': 'casuser', 'replace': 'true'},
        selectOut={"name":'covid_vaccines_select', "caslib" :'casuser', "replace" : 'true'},
        infoOut={"name":'covid_vaccines_info', "caslib" :'casuser', "replace" : 'true'},
        lead=30
    )

    forecasted_data = s.CASTable('covid_vaccines', caslib='casuser').to_frame().drop(columns='_NAME_')

    # Last date in our original dataframe
    # used to generate the vertical line
    # to split the graph into actual and
    # forecasted data
    predictions_after = datetime.strptime(df.sort_values(by='date').iloc[-1]['date'], '%Y-%m-%d')
    pyplot.plot(forecasted_data['dates_cas'], forecasted_data['PREDICT'])
    pyplot.plot(forecasted_data['dates_cas'], forecasted_data['ACTUAL'])
    pyplot.axvline(predictions_after)
    pyplot.xlabel('Date')
    pyplot.ylabel('Total Vaccinations (millions)')
    pyplot.savefig('out.jpg', type='jpg')

    # return FileResponse('out.png')
    return {'plot': base64.b64encode(open('out.jpg', 'rb').read()), 'tbl': forecasted_data.to_html()}
Again, run the server using uvicorn main:app, and your new webservice will start!
3. Create a frontend web application for users to interact with
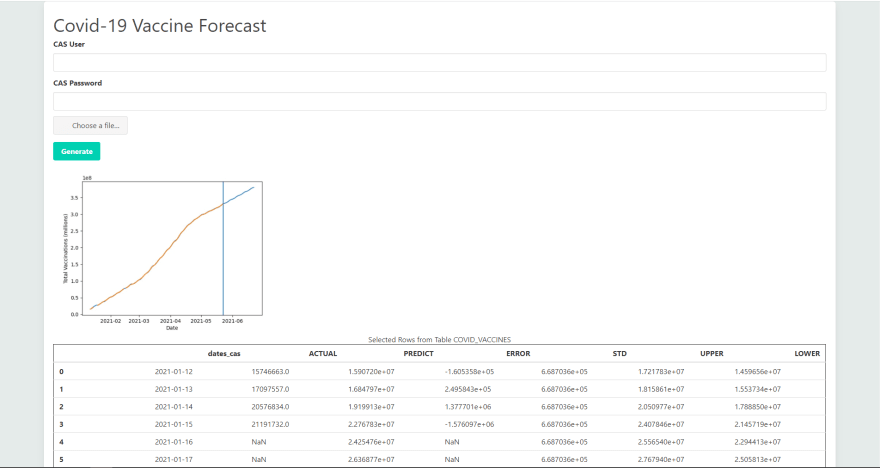
You can complete and design this part however you'd like. I built a basic page using Bulma for styling. I then wrote up a quick script using jQuery Ajax to send a request to our new server. You can view my frontend here.
Once we run our code, our web application will show both the plot and the forecasted data for our project!

Testing
You can run this forecasting model on any dataset similar to the one above. We can use Excel or pandas to create subsets of the data, filtered by state. You can then submit that state's specific data at any time to get a new forecast.

Top comments (0)