
It’s a long tradition at Bitrise that we compile the biggest learnings from the previous year in our annual State of App Development blog post. Let’s take a look at what 2021 brought our way, shall we?
In 2021 we spent a great deal of time building new features for you to help you Step up your game on mobile. In addition, we frequently analyzed a ton of behavioral data and run user surveys to understand how we could improve Bitrise to give the finest experience for mobile developers. Here is the big picture of what we've found - as every year, we've broken it down into numbers to present it to you in a way you might find interesting.
Total build time of all active apps on Bitrise
In 2021, your builds ran for 5,915,281 hours on Bitrise, that is 675 years! (You know what happened 675 years ago? The Hundred Years' War!)
Platform distribution
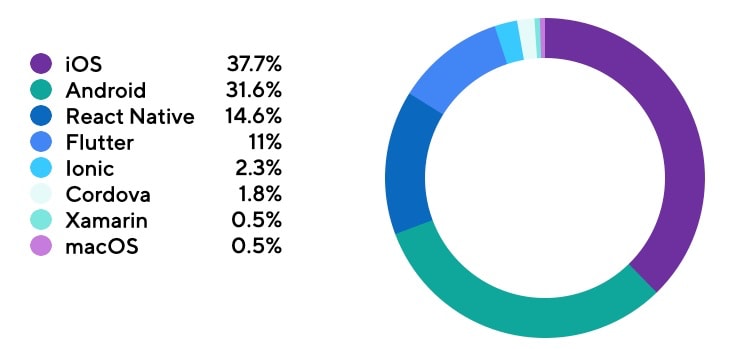
Native platforms are still the biggest: iOS keeps its significant lead, but interestingly, its share decreased by more than 2%. Android, however, gained 1.6%
As for cross-platforms: React Native also increased by 1.6% and Flutter by 2%. Ionic and Cordova’s shares both decreased somewhat after a steady increase for years.
MacOS also saw a small decline last year and we think that this is the result of Mac Catalyst being released last year.
And sadly, due to the steady decline in the number of Xamarin projects on Bitrise, Bitrise will not officially support Xamarin any longer (however, there is an unofficial way to continue building Xamarin projects).
Xcode delivery and adoption
Bitrise keeps delivering the new Xcode versions within the 48-hour window from the GA announcement. Last year, folks run the most builds on 12.5 reaching its peak in mid-September. But as soon as 13.0. GM dropped, they switched almost immediately.
13.2.1 GA was announced unexpectedly on 17 December and it was taken up by developers all around the world as - for the first time ever, - Apple continued accepting submissions in App Store Connect throughout the holidays. Well, Bitrise was not a bottleneck for releasing apps on the newest Xcode even around the holidays.

Git hosting in the cloud

Throughout the years we’ve been collecting data, our users always had the most repos on GitHub, but the increase of their share stopped at 56% in 2019 and since then decreased to 45%.
Bitbucket, the second major player kept losing repos from 2017 to 2019, however, GitHub’s loss is Bitbucket’s gain: in the past 2 years, they went from 24% to 33%. Custom solutions, GitLab, and Self-hosted GitLab kept their old shares.
The Devs
In our survey, we asked a couple of interesting questions about how our users work and their mobile app related incomes. Our questions were mostly (94%) answered by folks working directly in mobile app development.
Income
Mobile development is money… and it costs the most in the US for companies. Mobile developers are the best-paid in North America, where the majority of our participants earn between $150,001 - $250,000, compared to $50,001 - $100,000 in Europe. 💸
We also tried to differentiate between folks working for a product company or in an agency, and it turned out that product companies usually pay better.
Work management
Remote and then hybrid work setup was forced on all the tech companies in 2020 by Covid. Of all the participants in our survey, 53% said that they are fully remote and 43% that they work in a hybrid setup. Only the remaining 4% work only in an office. This data seems to fit what we hear about tech companies and how developers love skipping office days.
Apps and their owners
The average number of apps each company builds on Bitrise keeps fluctuating: it was 2.35 in 2017, 3.35 in 2018, and then 6.47 in 2019. In 2021, on average, each company has 2.76 apps, but some of our largest customers build hundreds of apps on Bitrise.
CI/CD: the best parts
This is no news for us, but according to folks in our survey, iOS code signing… is difficult? When asked, it got named as the number one problem that a CI/CD solution has to fix. (And we have recently tried to make it even simpler than before.)
The second most important thing in CI/CD was deploying simultaneously to various services, followed by managing app dependencies for product companies and testing for agencies. The fourth: the other way round. 👀
The least important feature for everybody was app store metadata and screenshots… we guess because it is often done by marketing anyway. (And they can manage them in our Ship add-on.)
Testing
Testing is a must, right? We keep seeing a steady rise in the number of tests running each year. 💫
In 2021, our users run 67% more unit tests than UI tests. The number of UI tests increased by 27%, and the number of unit tests by 24% compared to the previous year.
From the survey we run before the holidays, we also know that 68% of our users run unit tests. 2nd most important is integration testing, then E2E UI testing, except for agencies, which find it less important than running functional tests and UAT tests.
As for testing on devices, more than half of our responders test their apps on on-premise devices, which must be fun. (No.) 36% use virtual devices in the cloud and 29% physical devices in the cloud. Only 2% replied that they do not use any devices at all.
Deploys and releases
On average, each app on Bitrise runs 2.43 deploy steps a week, which means that they create this many deploys to either the app stores or testers.
Out of these, apps were sent to any of the app stores more than 2.5 million times, which is almost 40% more than last year!
The number of internal releases was even more staggering: almost 16 million times! That is a 27% growth in one year.
Does this mean that folks publish more confidently? We’re not sure, but one thing is sure: internal releases help create a tight feedback loop between developers and testers, and fewer bugs for users.
We asked our users about the reasons that drive a new version release for the apps they work on. Product companies - with an assumedly more mature DevOps setup - release on a regular release cadence 59% of the time. Bug fixes come up second with 17% and introducing new technologies third with 7%.
For agencies, in contrast, the number of bug fix related releases equal the regular release schedule, so agencies fix bugs more times than product companies.
Some Build Insights
I’ve already mentioned that in 2021, your builds ran for 5,915,281 hours on Bitrise. Let’s see some more interesting stats that might come in handy if you want to compare your build stats to others'. How do your builds compare?
- average build time: 1076 sec (18 mins)
- average success rate: 68,4%
Flaky tests are a real problem, so we are working on a solution that will help users identify them by comparing historical test reports in Build Insights. This particular feature has not been released yet, but
I can show you some data already. In the past two months:
- Percentage of tests that require a re-run to complete: 1.9%
- The amount of time spent on re-run tests: 3.5 million seconds (972 hours)
You’ll also be able to check out how long certain Steps run, so let us give you the average durations for a couple of popular Steps:
- Xcode Archive & Export for iOS: 752.1 sec
- Android Build: 352.7 sec
- Xcode Test for iOS: 705.7 sec
- Android Unit Test: 183.5 sec
- Git Clone Repository: 42.2 sec
You can check out Build Insights now too. ✨
Our Steps and integrations in numbers 🌟
There are currently around 350+ Steps and integrations in the Bitrise ecosystem. Maintained by us, our partners, and the community, each of these Steps is responsible for a small task, ranging from running tests, archiving the app, deploying, releasing, or notifying team members. During a build, a series of Steps run in the order defined in a Workflow.
In 2021, our 350+ steps ran a grand total of 209,860,771 times.
The most used Step in our Library
Like ever, our Script Step ran the most times in 2021. This Step is used when someone needs to run a custom command or install/update a tool that is not (yet) available on our virtual machines. (This is also the Step that fails the most times, so we suggest using the official Steps if possible. Maintenance is also easier for Steps from the out-of-the-box ones.)
Apart from the usual suspects in the default workflows: Slack comes with over 6 million runs and Fastlane with over 4,5 million. 🚀

Top build Steps 👷
- Gradle Runner
- Xcode Archive and Export for iOS
- Android Build
- Flutter Build
- Android Build for UI Testing
Last year, we predicted Flutter Build would climb higher, and yup, it did overtake Android Build for UI Testing.
Top test Steps 🧪
- Xcode Test for iOS
- Android Unit Test
- Android Lint
- Gradle Unit Test
- Virtual Device Testing for Android
This list is exactly the same as last year, the only thing that changed was the number of times they run: most of them run 1.5x times more than last year.
We do have the mention the 6th one, however, as it’s kept missing the Top 5 list for years now. Danger is a very useful Step helping users avoid some typical errors. Have you tried it yet?
Top deploy Steps 🚀
- Deploy to Bitrise.io - Apps, Logs, Artifacts
- Firebase App Distribution
- Google Play Deploy
- Deploy to App Store Connect with Deliver
- Firebase dSYM Upload
Deploy to Bitrise.io being the top 1 is not very surprising as when using Bitrise, you need to deploy your app and artifacts there to be able to use them later. Firebase is also kept its second place, but Google Play Deploy beat Deploy to App Store Connect with Deliver (formerly Deploy to iTunes Connect - Application Loader) for the first time in the history of the series.
Top notification Steps 💬
- Send a Slack message
- Send a Microsoft Teams message
- Comment on GitHub Pull Request
- Post Jira Comment
- Send a Discord message
The top spots remained the same, with Slack’s whopping 6M runs in 2021. Teams also did very well last year and their usage more than 2.5x-ed. Also, Discord overtook Telegram in 5th place.
We hope these insights were as interesting for you as for us. We love feedback, so tweet us or comment on our social pages if you have any suggestions, or if we missed anything you might be interested in! We're proud to help so many great people saving countless hours and ensuring code quality, making sure that you have more time for your ideas and for your code.
Please share this article! For more, keep an eye out by following us on Twitter.

Top comments (1)
Awesome article - Great work, all!