I've been running this blog for almost three years now. I've used Google Analytics, not only to track the amount of users, but also to actively improve my blog.
I'm no marketeer, just a simple developer. Today I want to share from my technical experience, how I use traffic data and react to it.
Filtering data
First and foremost, the boring part. It takes less than five minutes to set up, but will improve the correctness of your data: filters.
As you know, Google Analytics works with a tracking code which you can place everywhere. That tracking code can easily be used somewhere else, polluting your data. I'm thinking of local development environments or, more malicious: people who steal your tracking code as a deliberate attack.
Luckily this can easily be prevented with filters. So take five minutes to set up some filters in the admin section:
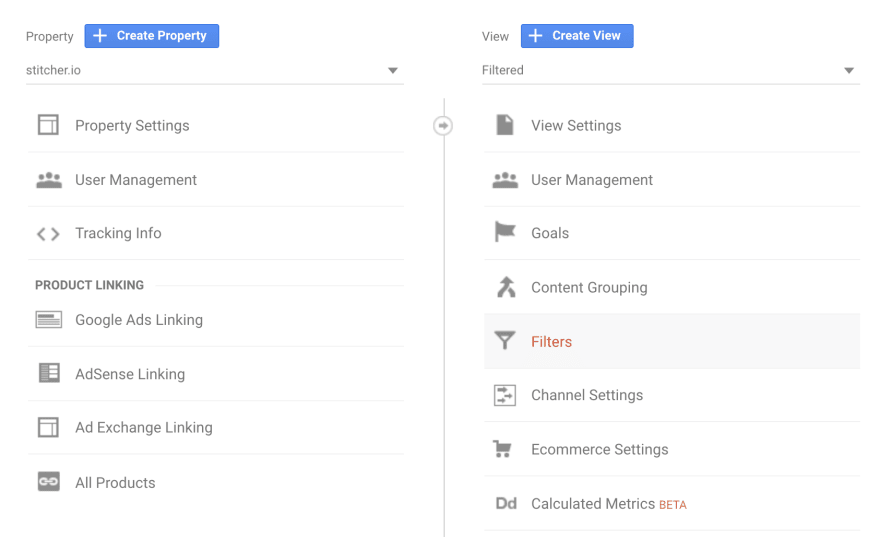
With filters, you can build a whitelist of traffic you want to include. I usually make a separate view called "Filtered", and keep the "All Web Site Data" view as is, for testing.
Here's an example of a filter I set up, to only include traffic from the "stitcher.io" domain:

You can also filter out local domains, whitelist IP addresses and more. If you want to be really safe, you could whitelist the IP address of your host, in combination with the host name.
With the correct filters set up, it's time to interpret data.
Decreasing bounce rate
Here's a good question to start with: "should I want to decrease my bounce rate"? The corporate marketeer will of course scream "YES".
Continue reading on https://stitcher.io/blog/analytics-for-developers

Top comments (0)