
Introduction
Hello kids! Are you in the mood for the art class?
We hope you are... because in this tutorial we will learn how to create “Blocky” – the very simple image editor that allows you to create your own characters pixel by pixel.
No magnifier glass required - just your mouse!
Feel free to personalize and extend the pixel editor as you wish. You can add features such as color selection and various drawing tools.
Also, don’t forget to check the Color Blocky - the more advanced version of this editor, with color selection.
What do you need?
To run the code in this article you don’t need to install anything on your local computer.
Just open the online JavaScript playground from codeguppy.com/code.html and copy and paste the code as indicated.
When ready, press the “Play” button to run the code.
Establishing the grid paper dimensions
The first step in our program is to draw the grid paper.
Therefore, we need to decide how many rows and how many columns we want on the canvas… and of course what will be each cell / square size.
Let’s define couple of constants to hold this information.
const squareSize = 16;
const noRows = 30;
const noCols = 50;
These constants act like settings for our program. We can come back and modify them later and the entire program will reflect the new values.
Drawing the grid paper
To draw the grid paper we can use either one of the following ways:
- We can draw horizontal and vertical lines in a pattern that define the grid paper, or
- We can draw small rectangles arranged in rows and columns to define the cells of our grid paper
We’ll select the second method in this tutorial.
The only challenge is to figure out the coordinates of each grid paper cell. At these coordinates we will have to display our rectangles. Since all cells are the same size, the top left coordinates of each cell can be obtained by multiplying the current column / row with the cell size.
Our code becomes as in the following listing ... and is ready to be tested! Copy the code in CodeGuppy editor and run it!
const squareSize = 16;
const noRows = 30;
const noCols = 50;

for(var row = 0; row < noRows; row++)
{
    for(var col = 0; col < noCols; col++)
    {
        var x = col * squareSize;
        var y = row * squareSize;

        rect(x, y, squareSize, squareSize);
    }
}
Note: The code assumes that the grid paper starts at the (0, 0) coordinates of the canvas. If you want to place the entire grid paper area in a different position, you will need to shift the x and y coordinates accordingly with the appropriate amount.
Refactoring the code
Let's refactor the code a little bit and extract all this logic that draws the grid paper in a separate function... and call it imediately.
The effect should be the same as before ... with the only difference that now the code is better encapsulated. Although we can parametrize the function, we will let it read the global consts for now.
const squareSize = 16;
const noRows = 30;
const noCols = 50;

displayGridPaper();

function displayGridPaper()
{
    for(var row = 0; row < noRows; row++)
    {
        for(var col = 0; col < noCols; col++)
        {
            var x = col * squareSize;
            var y = row * squareSize;

            rect(x, y, squareSize, squareSize);
        }
    }
}
Adding blocks
With grid paper in place, let's define the mousePressed() function. If defined, this function will be called automatically by the CodeGuppy engine each time you click the mouse button.
To verify that the mousePressed() is called correctly, let's make this function draw a small black rectangle at mouse coordinates.
Remember: mouseX and mouseY are system varibles that contains the mouse cursor position. The CodeGuppy runtime will automatically update thes variables each time the mouse cursor moves.
Assuming you still have the CodeGuppy editor opened, add the following function in the code and run again the code.
function mousePressed()
{
    fill('Black');
    rect(mouseX, mouseY, squareSize, squareSize);
}
Did you run the code? The program already starts to look how we want!
Find hit square
The challenge that we have now is to make the mousePressed() function draw the black rectangle at the exact coordinates of the grid paper cell beneath - no matter where we click with the mouse inside that cell.
This is how we plan to do this:
- Find the row / column index of the grid paper cell. This can be easily determined using the inverse operation that we used when we drew the grid paper: we will use division.
var col = Math.floor( mouseX / squareSize );
var row = Math.floor( mouseY / squareSize );
Note: The Math.floor JavaScript function is used to round up the result of the division to the closest lower integer number.
- Once we have the row / column index, we can recalculate the (x, y) pixel coordinates of that cell. These are the same coordinates that we'll use to draw our black rectangle.
var x = col * squareSize;
var y = row * squareSize;
That's it! Our program is done! It should look like this:
const squareSize = 16;
const noRows = 30;
const noCols = 50;

displayGridPaper();

function mousePressed()
{
    var col = Math.floor( mouseX / squareSize );
    var row = Math.floor( mouseY / squareSize );

    var x = col * squareSize;
    var y = row * squareSize;

    fill('Black');
    rect(x, y, squareSize, squareSize);
}

function displayGridPaper()
{
    for(var row = 0; row < noRows; row++)
    {
        for(var col = 0; col < noCols; col++)
        {
            var x = col * squareSize;
            var y = row * squareSize;

            rect(x, y, squareSize, squareSize);
        }
    }
}
If you want, check carefully the lines we've added and copy them in the CodeGuppy editor opened. If you experience errors, just replace the entire code in the editor with the one above.
Run it and see how it behaves!
Avoid the clicks
The program does the job just fine... but the constant mouse clicking is kind of anoying.
We can avoid the mouse clicks by moving all the code in the mousePressed function in the loop function.
Remember: The
mouseClickedwas called by the runtime each time the mouse button was clicked. Theloopfunction will be also automatically called by the runtime many - many times per second.
Run now the program and observer the difference in behavior!
Adding back the click
The loop solution solves the too many clicks issue... but now the program will just continously draw without having an option to specify when to draw and when not do draw.
It will be nice to check the state of the mouse buttons inside the loop function and run the loop code only if the mouse is pressed. The CodeGuppy environment put at our disposal the mouseIsPressed system variable. Like mouseX and mouseY variables this is also updated automatically by the runtime.
Using the code editor on the right, try to wrap the loop function code in an if condition:
if (mouseIsPressed)
{
    ...
}
When done editing the code, press the 'Play' button to see if your modification works.
If you added the if correctly, the code should run now as expected!
With
if (mouseIsPressed)condition in place inside theloopfunction, our code will draw now only when the mouse button is pressed.
Code refactoring
It is time for a small code refactoring. We suggest you to do this as an exercise:
- extract the code responsable with coloring of a cell in a separate function
displayCell(x, y) - move the reading of the mouse position outside of
displayCellfunction. - add a protection inside the
displayCellfunction in case the user tries to color cells outside the grid paper.
Delete cells
Hopefully your code works!
Anyway, below is included the program as of now with some comments added as a bonus.
const squareSize = 16;
const noRows = 30;
const noCols = 50;

displayGridPaper();

function loop()
{
    // Call to displayCell at mouse coordinates, only if mouse is pressed
    if (mouseIsPressed)
    {
        displayCell(mouseX, mouseY);
    }
}

// Display the cell that contains the point (x, y)
function displayCell(x, y)
{
    var col = Math.floor( x / squareSize );
    var row = Math.floor( y / squareSize );

    if (col >= noCols || row >= noRows)
        return;

    // determine the cell left upper-corner x and y coordinates
    var cellX = col * squareSize;
    var cellY = row * squareSize;

    fill('Black');
    rect(cellX, cellY, squareSize, squareSize);
}

// Display the grid paper using a series of white rectangles
function displayGridPaper()
{
    for(var row = 0; row < noRows; row++)
    {
        for(var col = 0; col < noCols; col++)
        {
            var x = col * squareSize;
            var y = row * squareSize;

            rect(x, y, squareSize, squareSize);
        }
    }
}
We only need one more feature:
Allow the operator to delete cells if the right-mouse button is pressed
We'll implement this feature by choosing the fill color as Black if the left-mouse button is pressed or White if the right-mouse button is pressed. The White color will simulate the delete effect.
Let's go ahead and extend the displayCell function to take one more argument: the color.
Inside the function we will use this argument instead of the Black constant we used before.
function displayCell(x, y, color)
{
    ...
    fill(color);
    rect(cellX, cellY, squareSize, squareSize);
}
... and of course we need to change also the place where the displayCell is used. In our case the loop function.
Inside this function we will also check which mouse button is pressed (the system mouseButton variable gives us this information) and decide on the color acordingly.
function loop()
{
    if (mouseIsPressed)
    {
        var color = mouseButton == LEFT ? "Black" : "White";
        displayCell(mouseX, mouseY, color);
    }
}
Do you take the challenge to do this modifications yourself in the code on the right? If yes, then go ahead and type the code.
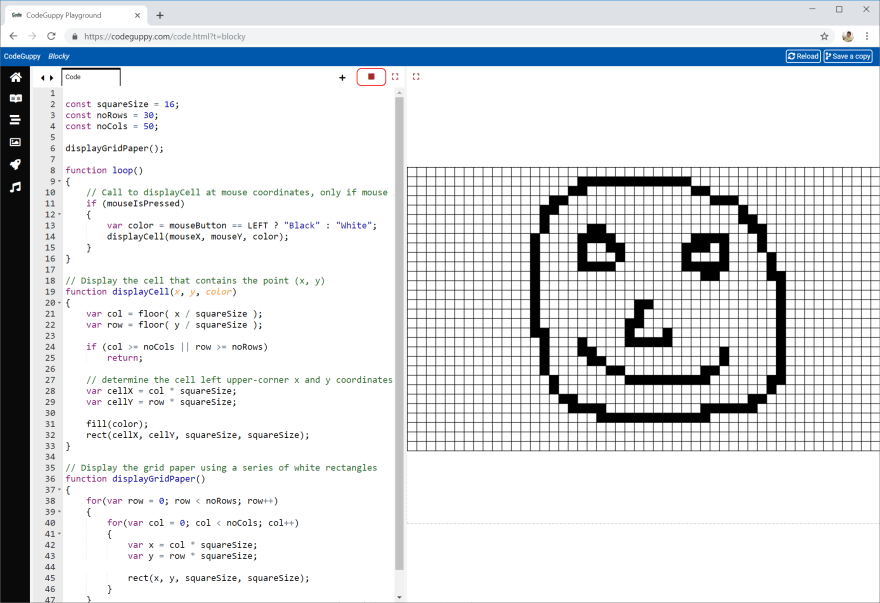
Conclusion
Our Blocky program is now complete.
Hopefully your code works! If not please try to debug it by comparing the code in the CodeGuppy editor with the following one.
const squareSize = 16;
const noRows = 30;
const noCols = 50;

displayGridPaper();

function loop()
{
    // Call to displayCell at mouse coordinates, only if mouse is pressed
    if (mouseIsPressed)
    {
        var color = mouseButton == LEFT ? "Black" : "White";
        displayCell(mouseX, mouseY, color);
    }
}

// Display the cell that contains the point (x, y)
function displayCell(x, y, color)
{
    var col = floor( x / squareSize );
    var row = floor( y / squareSize );

    if (col >= noCols || row >= noRows)
        return;

    // determine the cell left upper-corner x and y coordinates
    var cellX = col * squareSize;
    var cellY = row * squareSize;

    fill(color);
    rect(cellX, cellY, squareSize, squareSize);
}

// Display the grid paper using a series of white rectangles
function displayGridPaper()
{
    for(var row = 0; row < noRows; row++)
    {
        for(var col = 0; col < noCols; col++)
        {
            var x = col * squareSize;
            var y = row * squareSize;

            rect(x, y, squareSize, squareSize);
        }
    }
}
Note: If you experience difficulties with the debugging ... just replace the entire program in CodeGuppy editor with version above.
We leave the code in this stage for you. If you like retro character drawing you can further extend Blocky into your dream retro sprite editor!
Happy coding!
Feedback
If you liked the article, please follow @codeguppy on Twitter and / or visit codeguppy.com for more tutorials and projects.

Top comments (0)