Today, we'll cover some of the ways that you might find quite useful in your everyday work. We'll go through some of the best practices for logging in AWS Lambda, and we will explain how and why these ways will simplify your AWS Lambda logging. For more information about similar topics, be sure to visit our blog page on our website. But, let's start with the basics. What is logging?
Logging In AWS Lambda
AWS Lambda is a service that will automatically monitor Lambda functions for you, and it will report the metrics via Amazon CloudWatch. In order to help you with resolving the function failures, Lambda logs will manage all requests by your function as well as it will automatically store logs that are generated by your code through Amazon CloudWatch Logs.
You're able to put logging statements in your code which will help in validating that your code is working correctly and as expected. Lambda integrates with CloudWatch Logs automatically, and it pushes all the logs from your code to a CloudWatch Logs group which is associated with a Lambda function. It's worth mentioning that using Lambda logs means that there are no extra charges, but don't forget that the standard CloudWatch charges will apply.
Centralize The Logging In AWS Lambda
You should know that there are various log aggregation services like Splunk, Logz.io, Sumologic, Papertrail, Logzilla, Logmatic.io, and numerous others. Why do we need them? They exist to help us move the Lambda logs from our existing CloudWatch Logs to another more stable log service. You should know that, for example, when you're processing CloudWatch Logs with a Lambda function, you need to be mindful of the number of simultaneous executions it creates since CloudWatch Logs is an asynchronous event source for Lambda. Let's say that you have 100 functions that run simultaneously. Every one of them will push logs to CloudWatch Logs. Therefore, this, in turn, is able to trigger 100 simultaneous executions of the log shipping function.
Furthermore, this event can potentially double the number of functions that are simultaneously running in your region. You should remember that there is a soft, regional limit of 1000 simultaneous executions for all functions. You can also make a Reversed Concurrency for the log shipping function which will limit its maximum number of simultaneous executions, but there is a risk of losing logs when the log shipping functions are suppressed.
Streaming Logs
Take a look at the CloudWatch console, and you'll see under the "Actions" tab an option to select a log group (one for every Lambda function), and then you can decide whether you should stream the data directly to Amazon's hosted Elasticsearch service. In case you're already a user of Elasticsearch service, this will come in quite handy, but if you're still thinking about the possible options, there are alternatives.
A more exciting way to stream your logs would be to stream them from CloudWatch Logs to a Kinesis stream first because from Kinesis stream Lambda function is able to process logs and forward them toward a log aggregation service of your choosing. With this way of log manipulation, you have complete control over the concurrency of the log shipping function. Following the increase of the log events, you're able to increase the shard number inside the Kinesis stream which will furthermore lead to an increased number of simultaneous executions of the log shipping function.
When creating a new function from a Lambda console, you're able to choose from a number of blueprints to push CloudWatch Logs to some other log aggregation service. This option enables you to write a Lambda function that will ship your CloudWatch Logs to a preferred log aggregation service, but there are some things you should be careful about.
New Log Groups Auto-Subscription
Every time you create a new Lambda function, a new log group will be automatically formed in CloudWatch Logs. What you want to avoid is a manual process of subscribing log groups to your function. Enabling CloudTrail and setting up an event pattern in CloudWatch Events will allow you to invoke different Lambda function every time a log group is created. This setup can be done manually from the CloudWatch console. In case you're working with several different AWS accounts, it's advisable to avoid making a manual configuration.
Serverless Framework allows you to set up the event source for this function in the serverless.yml file. Remember that you must avoid subscribing the log group for the ship-logs function to itself since it will create an infinite invocation loop. After Lambda creates a new log group for your function, the retention policy is to keep them (forever!). It is totally unnecessary, while the storage for all these logs can cost pretty much since the logs can add up over time. Luckily, you can add another Lambda function which can automatically update the retention policy to something much more adequate
What is Dashbird Offering?

You should know that with Dashbird you'll be able to do a lot with little effort, whatsoever. Take into consideration that Dashbird's data collection goes directly from CloudWatch APIs and that there's no overhead when it comes to using Dashbird, which is another way of saying that you won't incur any extra costs nor will your app be slowed down by extra requests. Another perk offered by Dashbird is Live Tailing which essentially gives you the opportunity to receive your function's log streams in real-time. X-Ray is another benefit provided by Dashbird whose seamless integration gives you the best tracing possibilities and it allows you to keep a close eye on what your invocation is doing.
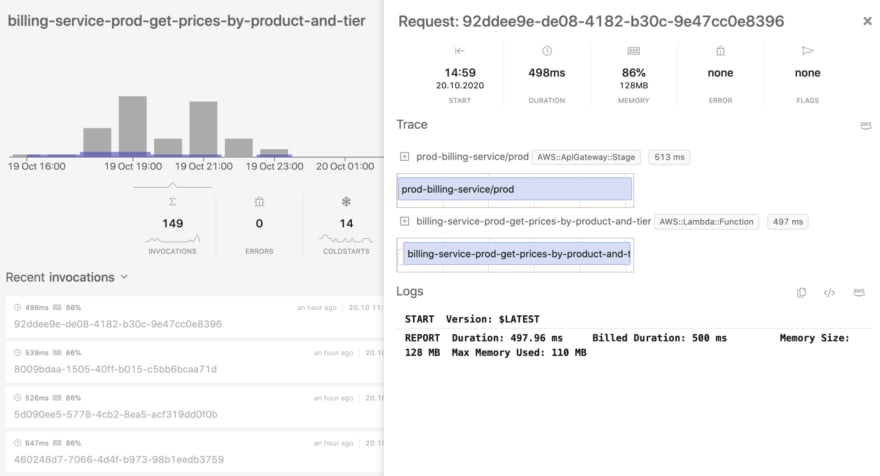
X-Ray is a potent tool that enables you to trace the data throughout the active cycle of the invocation while it also serves as a tool to track the full extent of an invocation flow. Supporting custom traces, X-Ray gives you the opportunity to track data manually. It's also worth mentioning that Dashbird can have an automated system of detecting if the X-Ray option is enabled or disabled. In case you open an invocation that belongs to a lambda that has active X-Ray monitoring it's able to get X-Ray data on-demand while it will also show you the results. We are free to say that Dashbird came through in providing you with an easy way of understanding how and when the time was lost and what actually happened there.
Where does that leave us?
Depending on what your needs are, you should either ship your logs to some of the log aggregation services or even stream your logs using Kinesis log streaming. Be careful when thinking about which log aggregate service you should choose since all of them have their perks and their faults. Try to avoid the infinite invocation loop; therefore the unnecessary added cost. Read the users' comments and their experiences, their ups, and downs, so you'll know upfront what you can expect from every single aggregation service and generally how to avoid situations you don't want to end up in.
Have you ever used Dashbird's logging to AWS Lambda before? In case you already have some good (or bad) experiences with logging in AWS Lambda, we encourage you to let us know about them and share it with our readers in the comment section below this article.

Oldest comments (0)