
Originally posted to Dashbird blog.
Traditionally in white-box monitoring, error reporting has been achieved with third party libraries, that catch and communicate failures to external services and notify developers whenever a problem occurrs. I'm here to argue that for managed services this can be achieved with less effort, no agents and without performance overhead.
In fact, there's a lot of reasons why you shouldn't use classical error-reporting tools in AWS Lambda. Most critical of them is that error-handling libraries in the code are blind to Lambda specific failures, such as timeouts, wrongly configured packages and out of memory failures. In addition, there is an issue with coverage -- implementing error reporting for each function is a lot of work. Whenever you add a service to your infrastructure, you must go through setting up error tracking and monitoring for it and forgotting to do it can result in blind-spots in your system.
Luckily, those problems can be solved quite easily and in most cases it's just a matter of adopting new tooling and development practices.
About the word "observability"
Before getting into details it's important to understand the idea behind observability. It doesn't mean that you'll have visibility or that you can even monitor your service right of the bat. It means that the system makes itself understandable by outputting data that enables the developer to ask any kind of arbitrary questions about the current or past state of the system. Fortunately the information emitting aspect is well implemented in AWS and serverless users for example have an opportunity to get visibility without specifically implementing extra stuff in their code.
Apart from CloudWatch logs, we could leverage AWS APIs for resource discovery and X-ray and CloudTrail for tracing and connecting execution flows.
We can make failure detection better today
The ability to detect failures across all functions and connect them with specific invocations, view logs and pull X-ray traces for them significally reduces the mean time to resolution in failure scenarios.

Lets break it down
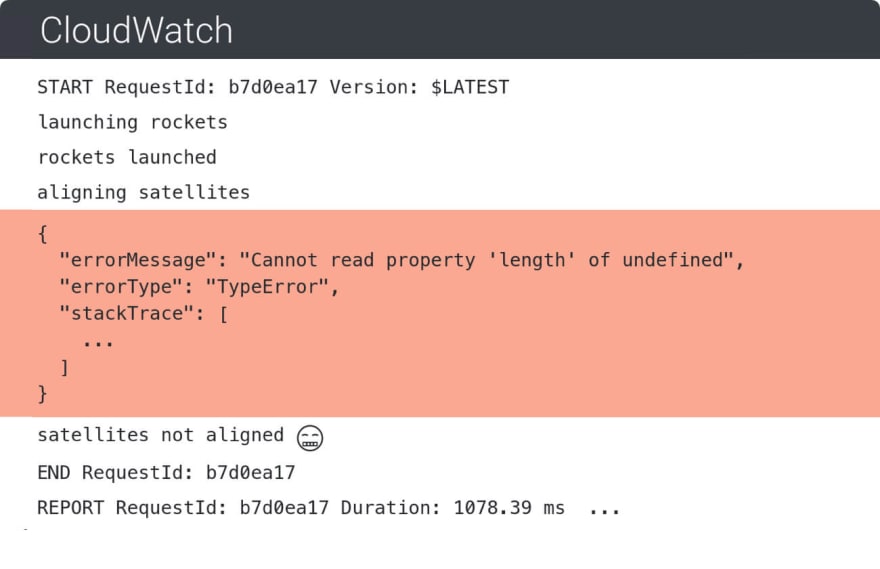
The only prerequisite for log-based error detection and visibility in general is that logs are pushed to CloudWatch (in most cases that is the default). From there on, we can do some smart pattern matching and deduction to detect failure scenarios.

On top of that, logs contain a lot of other data that indicate latency and memory usage and allow us to connect requests with AWS X-ray and search for a trace report for a specific request. All this allows us to gather a lot of context in order to understand what went wrong in a particular case.
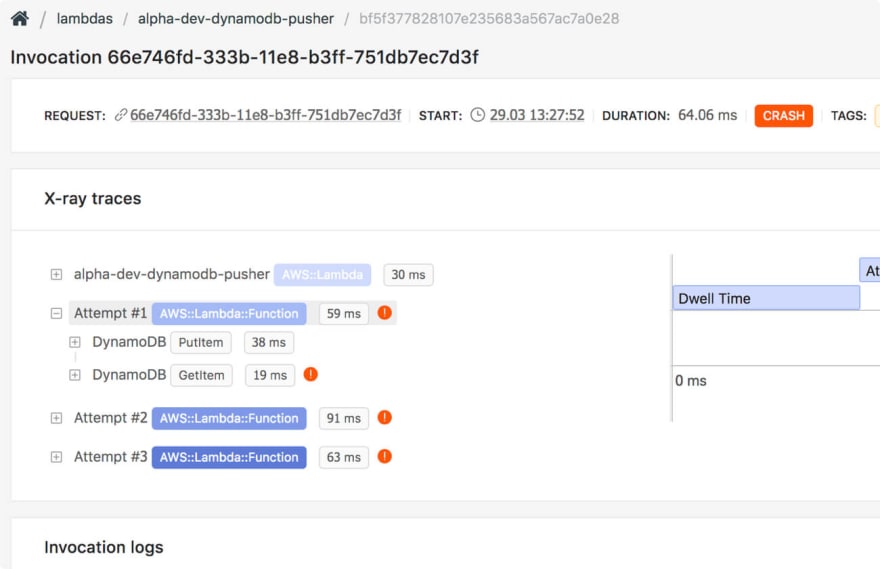
Here's what an X-ray trace contains when you search for it for a specific Lambda request. This enables you to catch errors in services your Lambda function touches.
Conclusion
With the emergence of managed and distributed services, the monitoring landscape will have to go through a significant change to keep up with modern cloud applications. Currently, devops overhead is one of the biggest obstacles for companies looking to use serverless in production and rely on it for mission-critical applications. Our team at Dashbird is hoping to solve that one problem at a time.
*Dashbird takes about 5 minutes to set up, after which you will get full visibility into your serverless applications. Give it a try by signing up here.*The phrase "better safe than sorry" gets thrown around whenever people talk about monitoring or getting observability into your AWS resources but the truth is that you can't sit around and wait until a problem arises, you need to proactively look for opportunities to improve your application in order to stay one step ahead of the competition. Setting up alerts that go off whenever a particular event happens is a great way to keep tabs on what's going on behind the scenes of your serverless applications and this is exactly what I'd like to tackle in this article.
AWS Lambda Metrics
AWS Lambda is monitoring functions for you automatically, while it reports metrics through the Amazon CloudWatch. The metrics we speak of consist of total invocations, throttles, duration, error, DLQ errors, etc. You should consider CloudWatch as a metrics repository, being that metrics are the basic concept in CloudWatch and they represent a set of data points which are time-ordered. Metrics are defined by name, one or even more dimensions, as well as a namespace. Every data point has an optional unit of measure and a time stamp.
And while Cloudwatch is a good tool to get the metrics of your functions, Dashbird takes it up a notch by providing that missing link that you'd need in order to properly debug those pesky Lambda issues. It allows you to detect any kinds of failures within all programming languages supported by the platform. This includes crashes, configuration errors, timeouts, early exits, etc. Another quite valuable thing that Dashbird offers is Error Aggregation that allows you to see immediate metrics about errors, memory utilization, duration, invocations as well as code execution.
AWS Lambda metrics explained
Before we jump in I feel like we should discuss the metrics themselves to make sure we all understand and know what every term means or what they refer to.
From there, we'll take a peek at some of the namespace metrics inside the AWS Lambda, and we'll explain how do they operate. For example
Invocations will calculate the number of times a function has been invoked in response to invocation API call or to an event which substitutes the RequestCount metric. All of this includes the successful and failed invocations, but it doesn't include the throttled attempts. You should note that AWS Lambda will send mentioned metrics to CloudWatch only if their value is at the point of nonzero.
Errors will primarily measure the number of failed invocations that happened because of the errors in the function itself which is a substitution for ErrorCount metric. Failed invocations are able to start a retry attempt which can be successful.
There are limitations we must mention:
- Doesn't include the invocations that have failed because of the invocation rates exceeded the concurrent limits which were set by default (429 error code).
- Doesn't include failures that occurred because of the internal service errors (500 error code).
DeadLetterErrors can start a discrete increase in numbers when Lambda is not able to write the failed payload event to your pre-configured DeadLetter lines. This incursion could happen due to permission errors, misconfigured resources, timeouts or even because of the throttles from downstream services.
Duration will measure the real-time beginning when the function code starts performing as a result of an invocation up until it stops executing. The duration will be rounded up to closest 100 milliseconds for billing. It's notable that AWS Lambda sends these metrics to CloudWatch only if the value is nonzero.
Throttles will calculate the number of times a Lambda function has attempted an invocation and were throttled by the invocation rates that exceed the users' concurrent limit (429 error code). You should also be aware that the failed invocations may trigger retry attempts automatically which can be successful.
Iterator Age is used for stream-based invocations only. These functions are triggered by one of the two streams: Amazon's DynamoDB or Kinesis stream. Measuring the age of the last record for every batch of record processed. Age is the sole difference from the time Lambda receives the batch and the time the last record from the batch was written into the stream.
Concurrent Executions are basically an aggregate metric system for all functions inside the account, as well as for all other functions with a custom concurrent pre-set limit. Concurrent executions are not applicable for different forms and versions of functions. Basically, this means that it measures the sum of concurrent executions in a particular function from a certain point in time. It is crucial for it to be viewed as an average metric considering its aggregated across the time period.
Unreserved Concurrent Executions are almost the same as Concurrent Executions, but they represent the sum of the concurrency of the functions that don't have custom concurrent limits specified. They apply only to the user's account, and they need to be viewed as an average metric if they're aggregated across the period of time.
Where do you start?
Cloudwatch
In order to access the metrics using the CloudWatch console, you should open the console and in the navigational panel choose the metrics option. Furthermore, in the CloudWatch Metrics by Category panel, you should select the Lambda Metrics option.
Dashbird
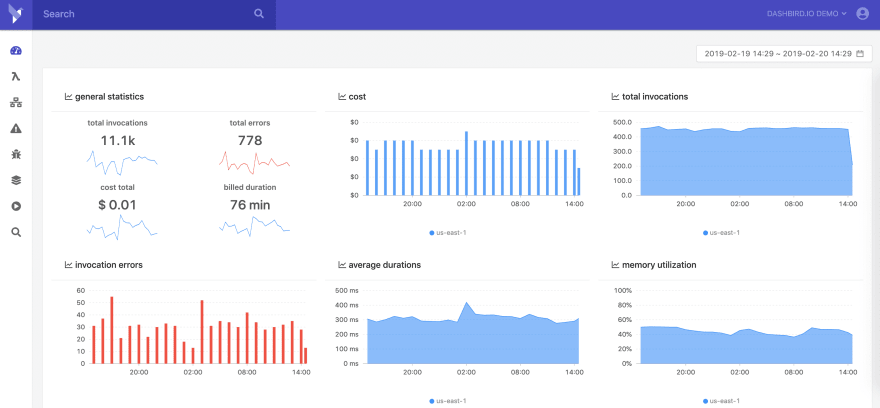
To access your metrics you need to log in to the app and the first screen will show you a bird's eye view of all the important stats of your functions. From cost, invocations, memory utilization, function duration as well as errors. Everything is conveniently packed onto a single screen.
Setting Up Metric Based Alarms For Lambda Functions
It is essential to set up alarms that will notify you when your Lambda function ends up with an error, so you'll be able to react proficiently.
Cloudwatch
To set up an alarm for failed function (can be caused by the fall of the entire website or even an error in the code) you should go to the CloudWatch console, choose Alarms on your left and click Create Alarm. Choose the "Lambda Metrics," and from there, you should look for your Lambda name in the list. From there, check the box of a row where the metric name is "Error." Then just click Next.
Now, you'll be able to put a name and a description for the alarm. From here, you should set up the alarm to be triggered every time "Errors" are over 0, for one continuous period. As the Statistic, select the "sum" and the minutes required for your particular case in the dropdown "Period" window.
Inside the Notification box, choose the "select notification list" in a dropdown menu and choose your SNS endpoint. The last step in this setup is to click the "Create Alarm" button.
Dashbird
Setting metric-based alerts with Dashbird is not as complicated, in fact, it's quite the opposite. While in the app, go to the Alerts menu and click on the add button on the right side of your screen and give it a name. After that you select the metric you are interested in, which can either be a cold start, retry, invocation and of course error. All you have to do is select the rules (eg: whenever the number of cold starts are over 5 in a 10 minute window alert me) and you are done.

How do you pick the right solution for your metric based alerts?
Tough question. While Cloudwatch is a great tool, the second you have more lambdas in your system you'll find it very hard to debug or even understand your errors due to the large volume of information. Dashbird, on the other hand, offers details about your invocations and errors that are simple and concise and have a lot more flexibility when it comes to customization. My colleague Renato made a simple table that compares the two services.

I'd be remiss not to make an observation: with AWS CloudWatch whenever a function is invoked, they spin up a micro-container to serve the request and open a log stream in CloudWatch for it. They re-use the same log stream as long as this container remains alive. This means the same log stream gets logs from multiple invocations in one place.
This quickly gets very messy and it's hard to debug issues because you need to open the latest log stream and browse all the way down to the latest invocations logs While in Dashbird we show individual invocations ordered by time which makes it a lot easier for developers to understand what's going on at any point in time.The phrase "better safe than sorry" gets thrown around whenever people talk about monitoring or getting observability into your AWS resources but the truth is that you can't sit around and wait until a problem arises, you need to proactively look for opportunities to improve your application in order to stay one step ahead of the competition. Setting up alerts that go off whenever a particular event happens is a great way to keep tabs on what's going on behind the scenes of your serverless applications and this is exactly what I'd like to tackle in this article.
AWS Lambda Metrics
AWS Lambda is monitoring functions for you automatically, while it reports metrics through the Amazon CloudWatch. The metrics we speak of consist of total invocations, throttles, duration, error, DLQ errors, etc. You should consider CloudWatch as a metrics repository, being that metrics are the basic concept in CloudWatch and they represent a set of data points which are time-ordered. Metrics are defined by name, one or even more dimensions, as well as a namespace. Every data point has an optional unit of measure and a time stamp.
And while Cloudwatch is a good tool to get the metrics of your functions, Dashbird takes it up a notch by providing that missing link that you'd need in order to properly debug those pesky Lambda issues. It allows you to detect any kinds of failures within all programming languages supported by the platform. This includes crashes, configuration errors, timeouts, early exits, etc. Another quite valuable thing that Dashbird offers is Error Aggregation that allows you to see immediate metrics about errors, memory utilization, duration, invocations as well as code execution.
AWS Lambda metrics explained
Before we jump in I feel like we should discuss the metrics themselves to make sure we all understand and know what every term means or what they refer to.
From there, we'll take a peek at some of the namespace metrics inside the AWS Lambda, and we'll explain how do they operate. For example
Invocations will calculate the number of times a function has been invoked in response to invocation API call or to an event which substitutes the RequestCount metric. All of this includes the successful and failed invocations, but it doesn't include the throttled attempts. You should note that AWS Lambda will send mentioned metrics to CloudWatch only if their value is at the point of nonzero.
Errors will primarily measure the number of failed invocations that happened because of the errors in the function itself which is a substitution for ErrorCount metric. Failed invocations are able to start a retry attempt which can be successful.
There are limitations we must mention:
- Doesn't include the invocations that have failed because of the invocation rates exceeded the concurrent limits which were set by default (429 error code).
- Doesn't include failures that occurred because of the internal service errors (500 error code).
DeadLetterErrors can start a discrete increase in numbers when Lambda is not able to write the failed payload event to your pre-configured DeadLetter lines. This incursion could happen due to permission errors, misconfigured resources, timeouts or even because of the throttles from downstream services.
Duration will measure the real-time beginning when the function code starts performing as a result of an invocation up until it stops executing. The duration will be rounded up to closest 100 milliseconds for billing. It's notable that AWS Lambda sends these metrics to CloudWatch only if the value is nonzero.
Throttles will calculate the number of times a Lambda function has attempted an invocation and were throttled by the invocation rates that exceed the users' concurrent limit (429 error code). You should also be aware that the failed invocations may trigger retry attempts automatically which can be successful.
Iterator Age is used for stream-based invocations only. These functions are triggered by one of the two streams: Amazon's DynamoDB or Kinesis stream. Measuring the age of the last record for every batch of record processed. Age is the sole difference from the time Lambda receives the batch and the time the last record from the batch was written into the stream.
Concurrent Executions are basically an aggregate metric system for all functions inside the account, as well as for all other functions with a custom concurrent pre-set limit. Concurrent executions are not applicable for different forms and versions of functions. Basically, this means that it measures the sum of concurrent executions in a particular function from a certain point in time. It is crucial for it to be viewed as an average metric considering its aggregated across the time period.
Unreserved Concurrent Executions are almost the same as Concurrent Executions, but they represent the sum of the concurrency of the functions that don't have custom concurrent limits specified. They apply only to the user's account, and they need to be viewed as an average metric if they're aggregated across the period of time.
Where do you start?
Cloudwatch
In order to access the metrics using the CloudWatch console, you should open the console and in the navigational panel choose the metrics option. Furthermore, in the CloudWatch Metrics by Category panel, you should select the Lambda Metrics option.
Dashbird
To access your metrics you need to log in to the app and the first screen will show you a bird's eye view of all the important stats of your functions. From cost, invocations, memory utilization, function duration as well as errors. Everything is conveniently packed onto a single screen.
Setting Up Metric Based Alarms For Lambda Functions
It is essential to set up alarms that will notify you when your Lambda function ends up with an error, so you'll be able to react proficiently.
Cloudwatch
To set up an alarm for failed function (can be caused by the fall of the entire website or even an error in the code) you should go to the CloudWatch console, choose Alarms on your left and click Create Alarm. Choose the "Lambda Metrics," and from there, you should look for your Lambda name in the list. From there, check the box of a row where the metric name is "Error." Then just click Next.
Now, you'll be able to put a name and a description for the alarm. From here, you should set up the alarm to be triggered every time "Errors" are over 0, for one continuous period. As the Statistic, select the "sum" and the minutes required for your particular case in the dropdown "Period" window.
Inside the Notification box, choose the "select notification list" in a dropdown menu and choose your SNS endpoint. The last step in this setup is to click the "Create Alarm" button.
Dashbird
Setting metric-based alerts with Dashbird is not as complicated, in fact, it's quite the opposite. While in the app, go to the Alerts menu and click on the add button on the right side of your screen and give it a name. After that you select the metric you are interested in, which can either be a cold start, retry, invocation and of course error. All you have to do is select the rules (eg: whenever the number of cold starts are over 5 in a 10 minute window alert me) and you are done.
How do you pick the right solution for your metric based alerts?
Tough question. While Cloudwatch is a great tool, the second you have more lambdas in your system you'll find it very hard to debug or even understand your errors due to the large volume of information. Dashbird, on the other hand, offers details about your invocations and errors that are simple and concise and have a lot more flexibility when it comes to customization. My colleague Renato made a simple table that compares the two services.
I'd be remiss not to make an observation: with AWS CloudWatch whenever a function is invoked, they spin up a micro-container to serve the request and open a log stream in CloudWatch for it. They re-use the same log stream as long as this container remains alive. This means the same log stream gets logs from multiple invocations in one place.
This quickly gets very messy and it's hard to debug issues because you need to open the latest log stream and browse all the way down to the latest invocations logs While in Dashbird we show individual invocations ordered by time which makes it a lot easier for developers to understand what's going on at any point in time.

Top comments (0)