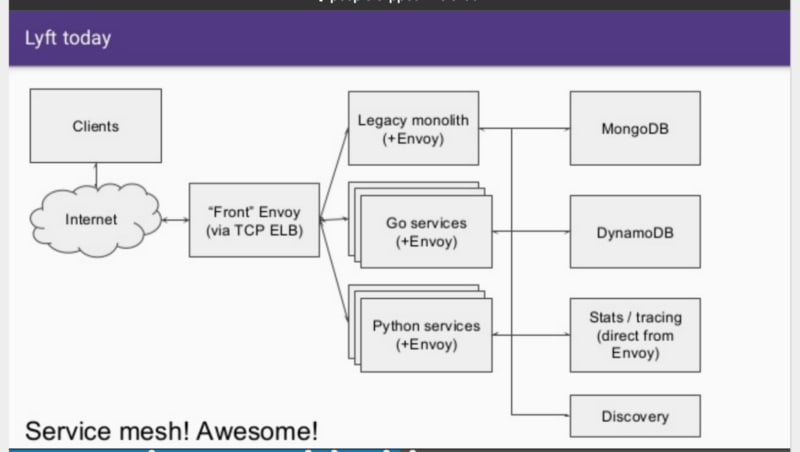
The concept of a “service mesh” is getting a lot of traction within the microservice and container ecosystems. This technology promise to homogenise internal network communication between services and provide cross-cutting nonfunctional concerns such as observability and fault-tolerance. However, the underlying proxy technology that powers a service mesh can also provide a lot of value at the edge of your systems — the point of ingress — particularly within an API gateway like the open source Kubernetes-native Ambassador gateway.
The State of SOA Networking
In a talk last year by Matt Klein, one of the creators of the Envoy Proxy, he described the state of service-oriented architecture (SOA) and microservice networking in 2013 as “a really big and confusing mess”. Debugging was difficult or impossible, with each application exposing different statistics and logging, and providing no ability to trace how requests were handled throughout the entire services call stack that took part in generating a response. There was also limited visibility into infrastructure components such as hosted load balancers, caches and network topologies.
It’s a lot of pain. I think most companies and most organizations know that SOA [microservices] is kind of the future and that there’s a lot of agility that comes from actually doing it, but on a rubber meets the road kind of day in and day out basis, people are feeling a lot of hurt. That hurt is mostly around debugging.
Maintaining reliability and high-availability of distributed web-based applications was a core challenge for large-scale organisations. Solutions to the challenges frequently included either multiple or partial implementations of retry logic, timeouts, rate limiting and circuit breaking. Many custom and open source solutions used a language-specific (and potentially even framework-specific) solution that meant engineers inadvertently locked themselves into a technology stack “essentially forever”. Klein and his team at Lyft thought there must be a better way.
Ultimately, robust observability and easy debugging are everything. As SOAs become more complicated, it is critical that we provide a common solution to all of these problems or developer productivity grinds to a halt (and the site goes down… often)
Ultimately the Envoy proxy was created to be this better way, and this project was released at open source by Matt and the Lyft team in September 2016.
The Evolution of Envoy
I’ve talked about the core features of Envoy in a previous post that covers another of Matt’s talks, but here I want to touch on the advanced load balancing. The proxy implements “zone aware least request load balancing”, and provides Envoy metrics per zone. As the Buoyant team have stated in their blog post “Beyond Round Robin: Load Balancing for Latency”, performing load balancing at this point in the application/networking stack allows for more advanced algorithms than have typically been seen within SOA networking. Envoy also provides traffic shadowing, which can be used to fork (and clone) traffic to a test cluster, which is proving to be a popular approach for testing microservice-based applications in production.
A core feature offered by Layer 7 (L7) proxies like Envoy is the ability to provide intelligent deployment control by basing routing decisions on application-specific data, such as HTTP headers. This allows a relatively easy implementation of blue/green deployments and canary testing, which also have the benefit of being controllable at near real time speed (in comparison with, say, an approach that uses the deployment mechanism to initialise and decommission VMs or pods to determine what services serve traffic).
Observability, Observability, Observability
Matt states in the talk that observability is by far the most important thing that Envoy provides. Having all service traffic transit through Envoy provides a single place where you can: produce consistent statistics for every hop; create an propagate a stable request identifier (which also required a lightweight application library to fully implement); and provide consistent logging and distributed tracing.
Being built around Envoy the Ambassador API gateway embraces the same principles. Metrics are exposed via the ubiquitous and well-tested StatsD protocol, and Ambassador automatically sends statistics information to a Kubernetes service called statsd-sink using typical StatsD protocol settings, UDP to port 8125. The popular Prometheus open source monitoring system is also supported, and a StatsD exporter can be deployed as a sidecar on each Ambassador pod. More details are provided in the Datawire blog “Monitoring Envoy and Ambassador on Kubernetes with the Prometheus Operator”.
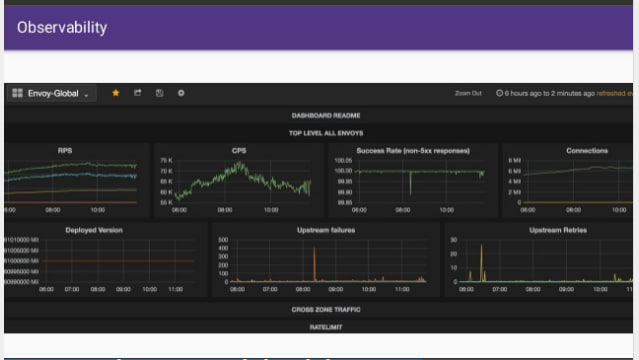
Creating effective dashboards is an art in itself, and Matt shared several screenshots of dashboards that he and his team have created to show Envoy data at Lyft. If you want to explore a real world example of this type of dashboard, Alex Gervais, staff software developer at AppDirect and author of “Evolution of the AppDirect Kubernetes Network Infrastructure”, recently shared the AppDirect team’s Grafana dashboard for Ambassador via the Grafana website.
The Future of Envoy
The best place to learn about the future direction of Envoy is the Envoy documentation itself. In the talk that I’ve covered in this post Matt hinted at several future directions that has since been realised. This includes more rate limiting options (be sure to check both the v1 and v2 APIs), and an open source Go-based rate limit service. The Datawire team have followed suite with a series on how to implement rate limiting on the Ambassador API gateway (effectively an Envoy front proxy), and also released demonstration open source code for a Java rate limiting service.
Undeniably the community has evolved at a fantastic pace since Matt gave the talk. The communities for Envoy, Istio and Ambassador (and several other Envoy-based services) are extremely active and helpful. So, what are you waiting for? Get involved and help steer the future of what are looking to be core components of modern cloud native application architectures. You can join the conversation here!
This post originally appeared on the Ambassador blog by Daniel Bryant.


Top comments (0)