While working on node-agent, we set out to measure network latency between containers and the services they communicate with. Since the agent has already discovered the endpoints that each container communicates with, we just need to measure network latency. We embedded "pinger" directly into the agent to measure end-to-end latency because the ICMP Echo requests should be sent from within the network namespace of each container.
I've looked at the most popular pinger implementations on Go, and unfortunately, all of them use userspace-generated timestamps to calculate RTTs (Round-Trip Times). This can lead to significant measurement errors, especially in the case of a lack of CPU time on the node due to throttling or high utilization.
Let's look at how ping actually measures RTT.

Though it looks simple enough, the devil is in the details. First, let's see how a packet is sent:

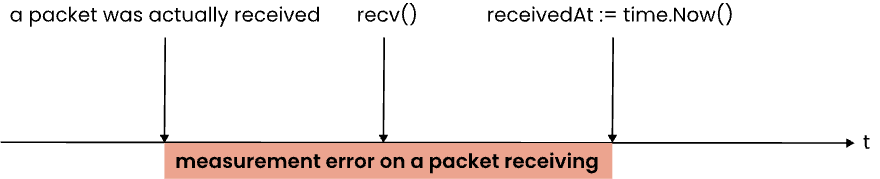
The main problem here is that a considerable amount of time can elapse between the request for a current timestamp and the actual sending of a packet. We can also see the same error in the receiving stage:
To illustrate the case where the error is quite noticeable, let's run ping in a container that is limited in CPU time. The -U flag tells ping to use userspace-generated timestamps.
docker run --rm -ti --cpu-period=10000 --cpu-quota=1000 --name pinger ping 8.8.8.8 -U
Then I'll start a CPU-consuming app in the same container:
docker exec -ti pinger stress --cpu 4
Here is the output:

As you can see, the measurement results were severely affected. If we run ping without -U, stress does not affect RTT at all. How does ping generate timestamps to exclude extra time spent before the packet is actually sent or after it is received?
There is an interface called SO_TIMESTAMPING that allows a userspace program to request the transmission/reception timestamp of a particular packet from the kernel. SO_TIMESTAMPING supports multiple timestamp sources, but we will only use those that do not require special hardware or device driver support.
SOF_TIMESTAMPING_TX_SCHED: Request tx timestamps prior to entering the packet scheduler.
SOF_TIMESTAMPING_RX_SOFTWARE: These timestamps are generated just after a device driver hands a packet to the kernel receive stack.
SO_TIMESTAMPING can be enabled for a particular packet (by using control messages) or for every packet passing through the socket:
flags := unix.SOF_TIMESTAMPING_SOFTWARE | unix.SOF_TIMESTAMPING_RX_SOFTWARE | unix.SOF_TIMESTAMPING_TX_SCHED |
         unix.SOF_TIMESTAMPING_OPT_CMSG | unix.SOF_TIMESTAMPING_OPT_TSONLY

err := syscall.SetsockoptInt(socketFd, unix.SOL_SOCKET, unix.SO_TIMESTAMPING, flags)
Immediately after we have sent a packet to the socket, we can request the kernel for the timestamp of the packet transmission:
err := send(sock, pkt.seq, ip)
// ...
oob := make([]byte, 1024) // a buffer for Out-Of-Band data where the kernel will write the timestamp
// MSG_ERRQUEUE indicates that we want to receive a message from the socket's error queue
_, oobn, _, _, err := syscall.Recvmsg(socketFd, pktBuf, oob, syscall.MSG_ERRQUEUE)
sentAt, err := getTimestampFromOutOfBandData(oob, oobn)
Then parsing the received message to extract the timestamp:
func getTimestampFromOutOfBandData(oob []byte, oobn int) (time.Time, error) {
    cms, err := syscall.ParseSocketControlMessage(oob[:oobn])
    if err != nil {
        return time.Time{}, err
    }
    for _, cm := range cms {
        if cm.Header.Level == syscall.SOL_SOCKET || cm.Header.Type == syscall.SO_TIMESTAMPING {
            var t unix.ScmTimestamping
            if err := binary.Read(bytes.NewBuffer(cm.Data), binary.LittleEndian, &t); err != nil {
                return time.Time{}, err
            }
            return time.Unix(t.Ts[0].Unix()), nil
        }
    }
    return time.Time{}, fmt.Errorf("no timestamp found")
}
Upon receiving, ancillary data is available along with the packet data, so there is no need to read anything from the socket error queue:
n, oobn, _, ra, err := conn.ReadMsgIP(pktBuf, oob)
//...
receivedAt, err := getTimestampFromOutOfBandData(oob, oobn)
And finally, we can calculate the RTT:
rtt := receivedAt.Sub(sentAt)
Another thing worth noting is that the timestamp of when the packet has been sent must be stored in the app's memory, not in the packet's payload. Otherwise, it can lead to funny consequences.
The resulting round-trip time reflects the real network latency much more accurately and is not subject to the mentioned errors. The agent uses this method to collect the container_net_latency_seconds metric for each container. Since this metric is broken down by destination_ip, you can always find out what the network latency between the container and each one of the services it communicates with is. The limitation of this method is that it doesn't work if ICMP traffic is blocked, such as in the case of Amazon RDS instances.
Useful links
- node-agent (Apache-2.0 License)
- How Coroot checks the correlation between network RTT and the app's SLIs
- Try Coroot for free (14-day trial)

Top comments (0)