During the last days, I see more and more projects related to epidemic simulations, SIR Modeling etc. It is obvious that the COVID-19 pandemic has motivated developers around the world to offer projects and solutions that try to predict the evolution of the pandemic in the following weeks or months.
Probably the simplest model someone can use to model an epidemic is the SIR model.
But how is the SIR model defined?
(From WolframMathworld)
An SIR model is an epidemiological model that computes the theoretical number of people infected with a contagious illness in a closed population over time. The name of this class of models derives from the fact that they involve coupled equations relating the number of susceptible people S(t), number of people infected I(t), and number of people who have recovered R(t).
The model needs the initial values of the Susceptible persons in a population (S0), Infected (I0) and Recovered (R0). It also needs beta factor which is a constant determining how often a susceptible-infected contact results in a new infection and gamma factor which is the rate an infected person recovers and moves into the resistant phase.
The simulation runs for N iterations (which represent the time span of the simulation).
Installation and example
SIR.js can be installed via npm by typing npm install sir.js .
Code is available in this GitHub repo and you are welcome to contribute!
It is ultrasimple to set it up and use it:
let SIRjs = require('sir.js');

let solution = SIRjs.solve({S0: 0.9, I0: 0.1, R0: 0.0, t:1, N: 500, beta: 0.35, gamma: 0.1});
SIRjs.printChart(solution);
It has only 2 functions: solve() and printChart()
solve() function takes an object argument with the following keys:
- S0: Initial S (Susceptible) value
- I0: Initial I (Infectious) value
- R0: Initial R (Recovered) value
- t: The time step
- N: The time span (in units of time) aka the length of the simulation
- beta: The parameter controlling how often a susceptible-infected contact results in a new infection
- gamma: The rate an infected recovers and moves into the resistant phase
It returns an array of objects that contain S,I and R values for each moment.
printChart() function prints an ASCII chart for each one of the S,I,R variables
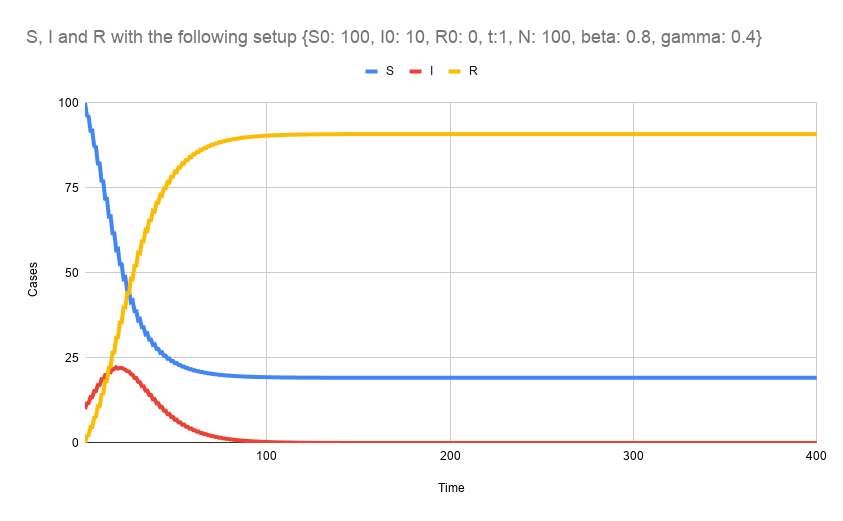
You can then plot the results in any way you want.
Here, for example, I have plotted the results using Google Sheets
That's all folks!
I hope you find it interesting and that it will be useful!

Top comments (0)