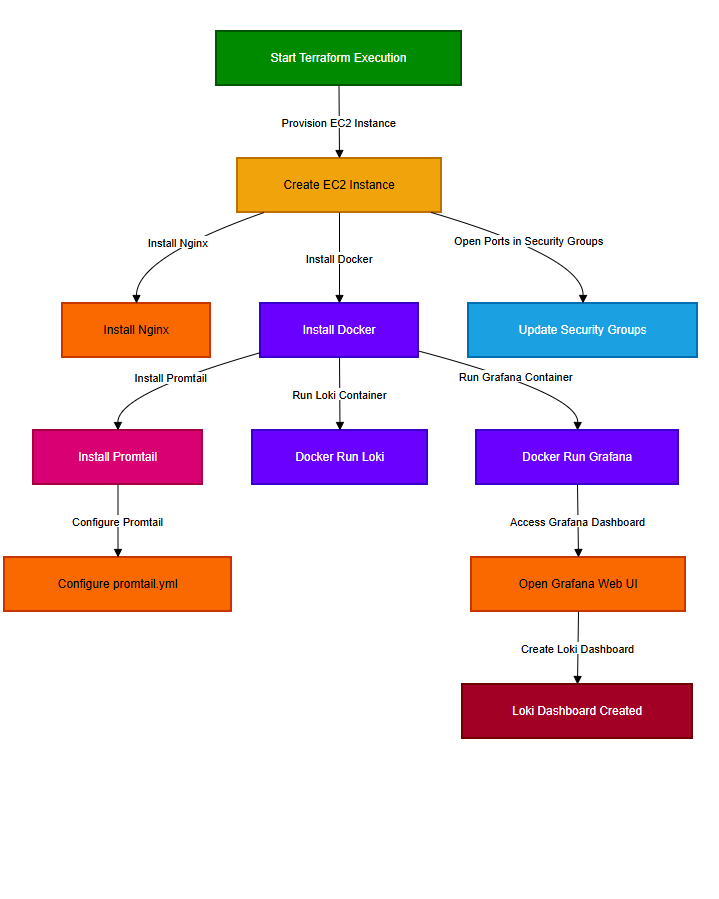
Open VS and then paste the tf script after reviewing. This terraform scripts does the following:
Creates an EC2 instance
Installs Nginx
Installs Docker
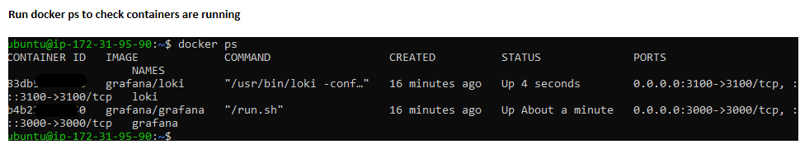
Runs Grafana and Loki as Docker containers
Installs Promtail and configures it
Opens the required ports in security groups
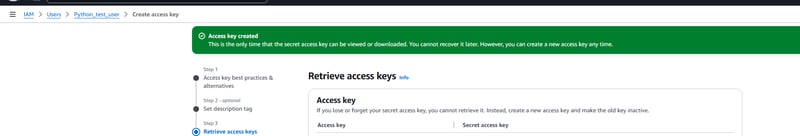
Make sure the aws cli access is enabled and access key and secret key details are mapped.
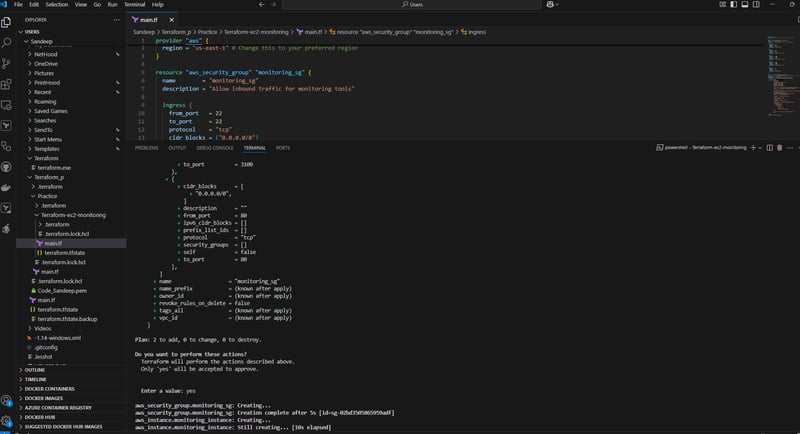
provider "aws" {
  region = "us-east-1" }
resource "aws_security_group" "monitoring_sg" {
  name        = "monitoring_sg"
  description = "Allow inbound traffic for monitoring tools"
  ingress {
    from_port   = 22
    to_port     = 22
    protocol    = "tcp"
    cidr_blocks = ["0.0.0.0/0"]
  }
  ingress {
    from_port   = 80
    to_port     = 80
    protocol    = "tcp"
    cidr_blocks = ["0.0.0.0/0"] # Nginx
  }
  ingress {
    from_port   = 3000
    to_port     = 3000
    protocol    = "tcp"
    cidr_blocks = ["0.0.0.0/0"] # Grafana
  }
  ingress {
    from_port   = 3100
    to_port     = 3100
    protocol    = "tcp"
    cidr_blocks = ["0.0.0.0/0"] # Loki
  }
  egress {
    from_port   = 0
    to_port     = 0
    protocol    = "-1"
    cidr_blocks = ["0.0.0.0/0"]
  }
}
resource "aws_instance" "monitoring_instance" {
  ami             = "ami-04b4f1a9cf54c11d0"
  instance_type   = "t2.micro"
  key_name        = "Grafana" # Change to your key name
  security_groups = [aws_security_group.monitoring_sg.name]
  user_data = <<-EOF
              #!/bin/bash
              apt update -y
              apt install -y nginx docker.io
              systemctl enable nginx
              systemctl start nginx
              systemctl enable docker
              systemctl start docker
              docker run -d --name=grafana -p 3000:3000 grafana/grafana
              docker run -d --name=loki -p 3100:3100 grafana/loki
              apt install -y curl
              curl -O -L "https://github.com/grafana/loki/releases/latest/download/promtail-linux-amd64.zip"
              apt install -y unzip
              unzip promtail-linux-amd64.zip
              mv promtail-linux-amd64 /usr/local/bin/promtail
              chmod +x /usr/local/bin/promtail
              cat <<EOT > /etc/promtail-config.yml
              server:
                http_listen_port: 9080
                grpc_listen_port: 0
              positions:
                filename: /tmp/positions.yaml
              clients:
                - url: http://localhost:3100/loki/api/v1/push
              scrape_configs:
                - job_name: system
                  static_configs:
                    - targets:
                        - localhost
                      labels:
                        job: varlogs
                        __path__: /var/log/*log
              EOT
              promtail -config.file=/etc/promtail-config.yml &
              EOF
  tags = {
    Name = "monitoring-instance"
  }
}
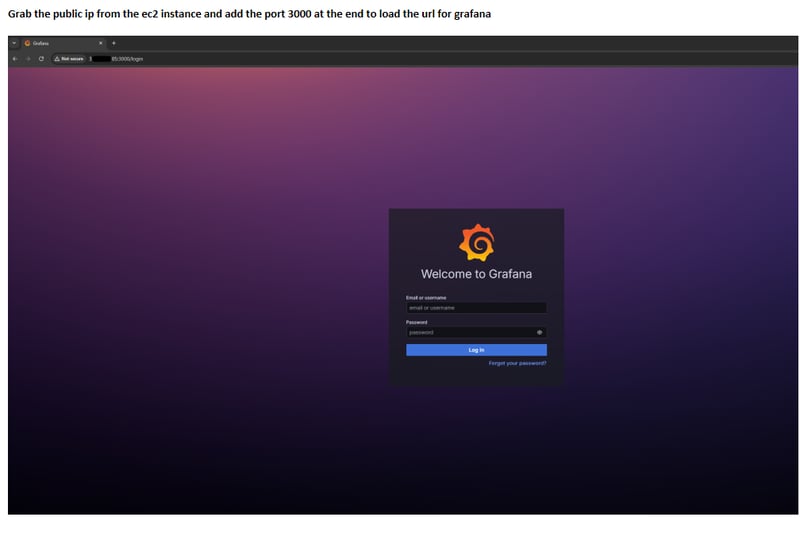
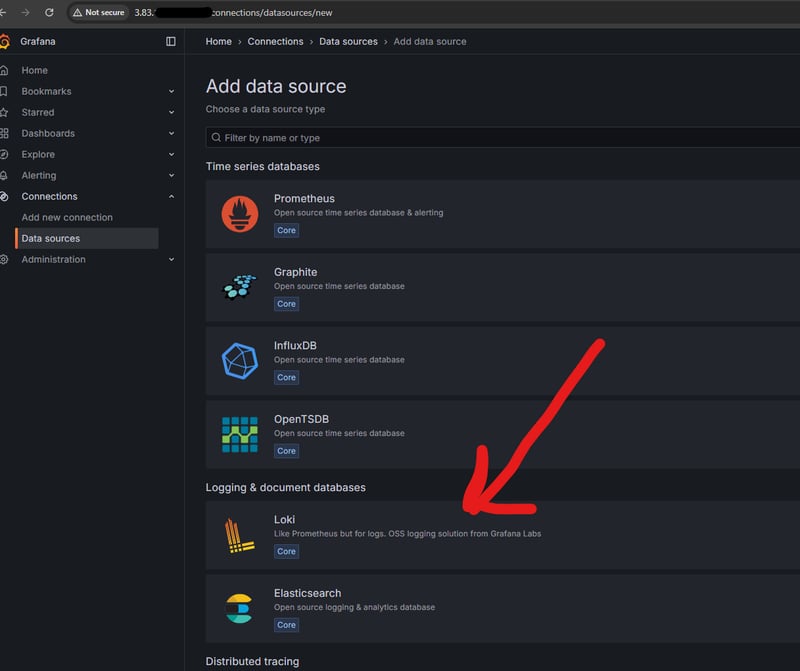
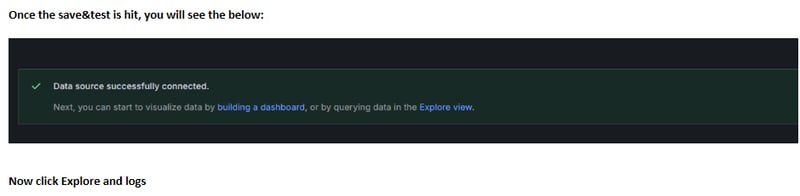
Now the portal opens up. Click on the data sources to add.
Here i will be adding loki (data source) to demonstrate in grafana (vizualisation, etc.).
Loki gets the data from promtail(scraper as it collects logs) and then sends to the grafana.
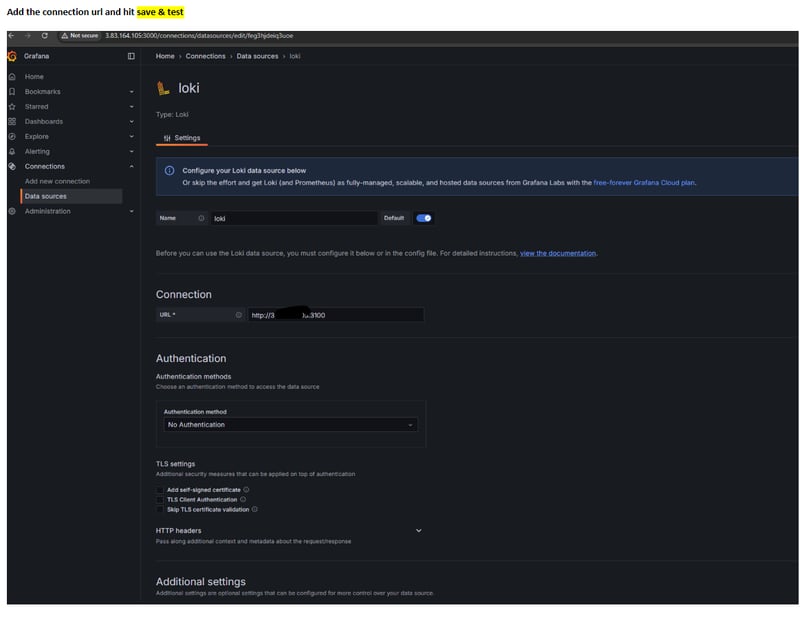
Click on Data sources<<add data sources<<loki
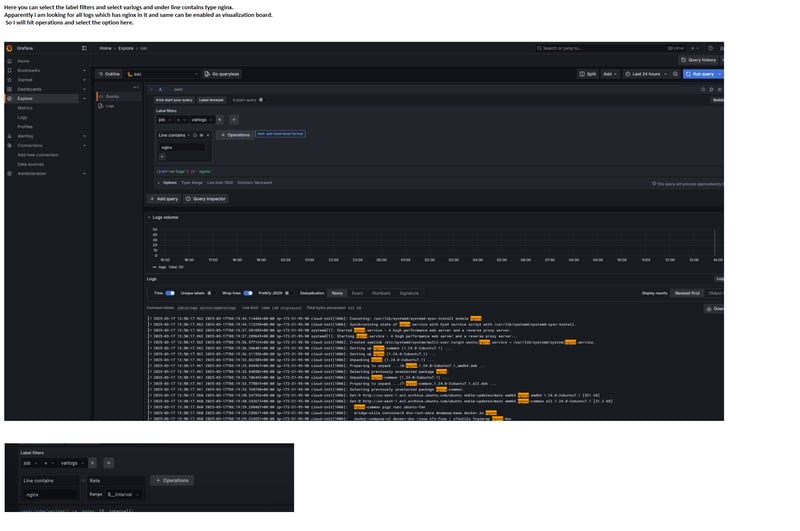
Here you can select the label filters and select varlogs and under line contains type nginx.
Apparently i am looking for all logs which has nginx in it and same can be enabled as visualization board.
So I will hit operations and select the option here.
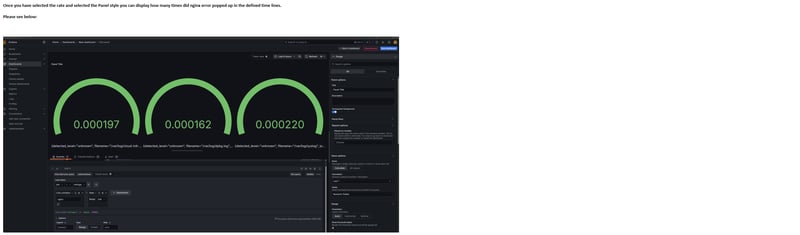
Once you have selected the rate and selected the Panel style you can display how many times did nginx error popped up in the defined time lines.
Please see below:

Top comments (0)