
Motivation
This is my submission of stage zero in the HNG 11 internship, I am currently deep exploring the field of data analysis , I believe this internship gives me the opportunity to learn and grow more in this field
To know more:
Observation from first glance
Looking at the Iris dataset from first glance,
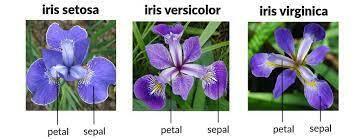
The Iris flower dataset comprises 150 samples with four features each: sepal length, sepal width, petal length, and petal width, distributed across three species: Iris-setosa, Iris-versicolor, and Iris-virginica, with 50 samples per species

Exploratory Data Analysis
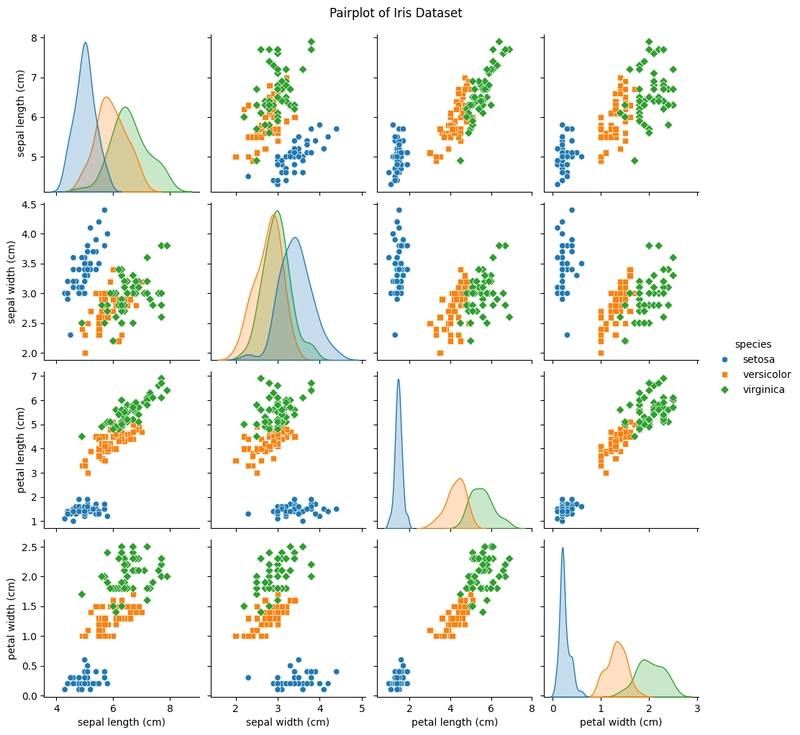
The pairplot above easily summarizes how the entire distribution of the 4 features are against the target variable.
We can infer all of the above
The pairplot of the Iris dataset provides a visual summary of the relationships between the four features (sepal length, sepal width, petal length, and petal width) for the three Iris species: setosa, versicolor, and virginica. Here are some detailed observations:
-
Species Separation:
- Iris-setosa: This species is distinctly separated from the other two species in almost all pairwise comparisons. The petal length and petal width features are particularly effective in distinguishing Iris-setosa, as the points representing this species form a distinct cluster in the lower left corner in the petal length vs. petal width plot.
- Iris-versicolor and Iris-virginica: These two species overlap more but show some degree of separation. The petal length and petal width features again provide good separation, with Iris-versicolor generally having smaller petal measurements compared to Iris-virginica. However, there is still some overlap between these two species in the middle range of the feature values.
-
Feature Distributions:
- The diagonal plots show the kernel density estimates (KDE) for each feature within each species. These plots reveal that the distribution of each feature varies significantly between species. For example, Iris-setosa has a much narrower and distinct distribution for petal length and petal width compared to the other two species.
- Sepal length and sepal width have more overlapping distributions, especially between Iris-versicolor and Iris-virginica, making them less effective for classification on their own.
-
Inter-feature Relationships:
- There is a noticeable positive correlation between petal length and petal width across all species, particularly within Iris-versicolor and Iris-virginica.
- Sepal length and petal length also exhibit a positive correlation, especially for Iris-versicolor and Iris-virginica, while Iris-setosa remains distinctly separated.
- Sepal width shows a weaker correlation with other features compared to the petal measurements.
-
Within-Species Variability:
- Iris-setosa shows low variability in petal measurements, which are consistently small.
- Both Iris-versicolor and Iris-virginica exhibit more variability in their petal measurements, with Iris-virginica generally showing the largest measurements.
CORRELATION
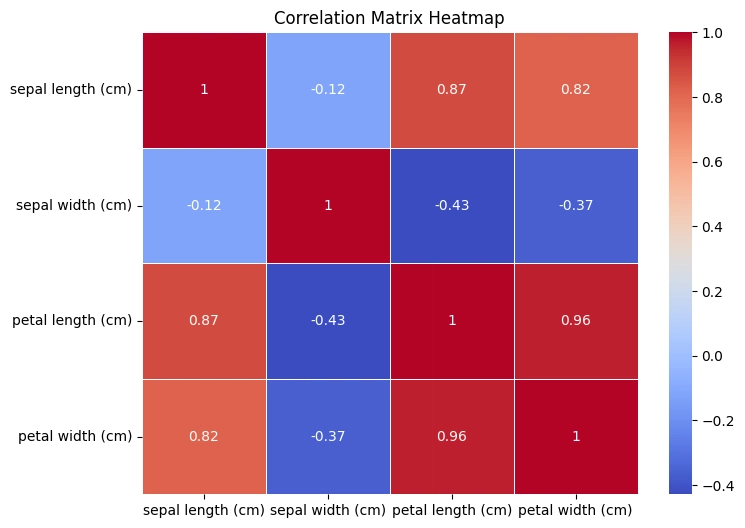
The correlation matrix heatmap of the Iris dataset reveals the relationships between the features. Sepal length shows a strong positive correlation with petal length (0.87) and petal width (0.82). Petal length and petal width are highly correlated (0.96), indicating that as petal length increases, petal width also tends to increase significantly. Sepal width, on the other hand, has a weak negative correlation with sepal length (-0.12) and moderate negative correlations with petal length (-0.43) and petal width (-0.37). These insights suggest that petal measurements are more strongly interrelated compared to sepal measurements, which are less correlated with each other and with petal measurements
Thanks so much for reading😊, Cya👋.

Top comments (1)
Excellent, I'm also working on this exercise in Python.