
Real User Monitoring, or RUM, is a type of monitoring technology for digital businesses that analyzes customers' digital experiences by looking at exactly how online visitors are interacting with a website or application, analyzing everything from page load events to AJAX requests to frontend application crashes. The most commonly known example of RUM would be Google Analytics, or GA, which tracks certain spectrums of the interaction between your user and your website or webapp. GA can track pageviews, click paths, browser types and traffic sources but is it really telling you how satisfied your users are?
As opposed to synthetic monitoring, the sole purpose of RUM is to monitor the real level of satisfaction of our users based on the performance of your website or webapp. Although GA does a good job at giving you high/level data about your end users' digital experiences it does not layout the data in a way that allows you to easily read into the overall level of satisfaction of your users. This monitoring software is part of APM (Application Performance Monitoring) and it allows you to stay in control of your users' digital experience, and in turn, their level of satisfaction. Want to learn more about APM? Check out our article on RUM vs. APM.
Thus the need for RUM. Real user monitoring can help organizations convert online customers faster, reduce churn and improve customers' overall digital experience. Today we will be breaking down the most common features found in a comprehensive RUM solution to help you get the most out of RUM. The combination of these features is what allows you to break down the data and get to know the quality of the interaction your users are having with your website or webapp. Some of the features we will be reviewing today are:
- Apdex
- Page load events
- Monitor Single-Page & Multi-Page Applications
- AJAX requests
- Alerting
- Sessionization
- Release tracking
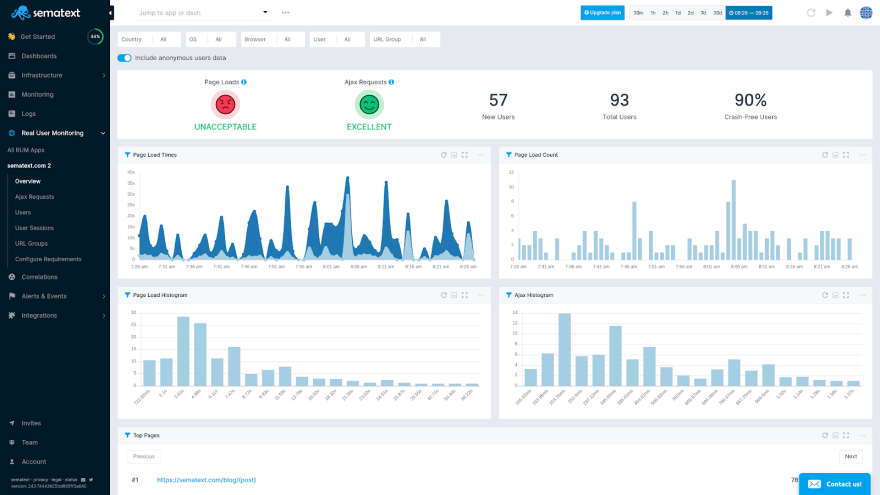
Example of Sematext Experience
Benefits of Real User Monitoring
First off let's start with some basic tasks your RUM solution can/should help you with:
- Problem-solving -- RUM helps you by understanding (through data) what is impeding a near-perfect experience for your users and troubleshooting those issues to improve their digital experience.
- Segmentation -- Not everyone uses the same browsers, connection types, etc. so limiting your performance improvements or testing to a certain operating system, browser, location, etc. doesn't really cover the basis for the masses of users that will interact with your website or webapp.
- Faster Actionable Insights -- Know right now what's affecting your UX (user experience). An alerting feature in your RUM solution allows you to monitor your UX in real-time and get actionable insights into your users' website or appexperience.
RUM Features and metrics
So how does RUM work? Let's begin breaking down some of the features and metrics a Real User Monitoring solution can contain.
Apdex
Application Performance Index, or Apdex, is a measurement of your users' level of satisfaction based on the response time of request(s) when interacting with your website or application.
The Apdex method takes your defined response time threshold (T), the sum of satisfactory response times plus half of the tolerable response times divided by the total number of samples (requests sampled) in order to calculate a ratio from 0 to 1. Here are some of the levels you may find your website or application to be scored at with Apdex:
- 1.00-0.94 = Excellent
- 0.93-0.85 = Good
- 0.84-0.70 = Fair
- 69 and 0.49 = Poor
- >0.49 = Bad
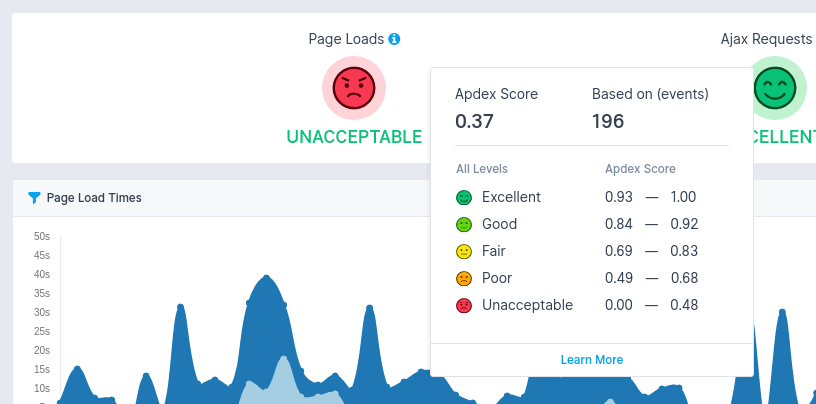
Example of Sematext Experience Apdex Scoring
The average Apdex score is 0.85 so if you are anywhere near that range, you're doing something right. Read more about how to use Apdex to measure user satisfaction here.
User Activity Monitoring through Page Load Events
Page load events are recorded using the browser timing APIs. Each page load event is recorded and later displayed on charts that show the time spent in the back end (network and web app) and the time spent in the browser.
In addition to load times, your RUM solution should also record the loaded resources (images, fonts, stylesheets, javascript files) and the associated loading times. Page load events help you by filtering web performance by url, browser type, and version, operating system, geolocation, etc.
Monitoring Single page applications
It's advisable to find a RUM solution that supports SPA or Single-Page Applications. As SPAs pack lots of different components, features, etc. into one page, the complexity of monitoring them increases. In order to monitor SPAs one would need to monitor JavaScript errors, details of those errors, number of samples, loading time and unloading of views.
Monitoring JavaScript errors are detrimental to monitoring SPAs as it can cause the entire page to crash. Let's compare MPA JavaScript errors to SPAs: If JavaScript fails on an MPA it can cause certain pages to crash but in a SPA, it can cause the entire page to crash, causing your users to possibly take off running in the direction of your competitor. WIth RUM, instead of looking for the root cause, jump right into that specific script and get it fixed thus allowing your users to interact with an error-free script.
Another part of monitoring SPAs are AJAX requests, let's read more about them below.
Tracking AJAX calls / requests
Any delay in loading resources, AKA, AJAX requests, can cause delays in time to load the entire page or limit the user to complete a transaction. The visual part of any SPA or MPA is one of the most important metrics to monitor, it is the measure of how long it takes for the SPA or MPA to actually be visible to the user.
Keep in mind that failed AJAX requests can impact your Apdex score and in turn, your entire UX. TIP: It is recommended to integrate your RUM solution with that of a Transaction Tracing solution so that you can see exactly where time on the backend was spent for these slow or failed AJAX requests.
Alerting
You should be able to create alerts for yourself based on the Apdex score and page load times. Any RUM solution should include this alerting feature as it's detrimental in order to troubleshoot a poor Apdex score, page-load time and more.
Sessionization
This feature allows you to inspect individual user sessions and see the timeline of page load events, on-page transactions, and AJAX requests made during the session. The session would ideally also include user information and any other metadata such as browser information). The goal of this view would be to help with troubleshooting issues reported by the user (or by crash reporting).
There are many popular RUM tools that help with sessionization such as Inspeclet, HotJar, and many others. However, tracking a part of that user session or *only *the user session does not give you the insights you need in order to understand what is impacting your users' digital experience.
Release tracking
Whenever developers release a new version of their website or webapp, they should be able to notify their RUM solution, possibly by sending a specific type of "release event", and upload source maps for that particular release. Tracking release events allow you to understand if there is a new release affecting your end-users' experience.
Conclusion
That concludes our features listing and descriptions. We hope that this list has helped you understand the value that Real User Monitoring can bring to an organization. In the event that you'd like to know more about how RUM helped organizations of all sizes improve their UX we suggest checking out Sematext Experience which offers support for:
- Page load events including support for single page applications (SPAs)
- AJAX requests
- Alerts based on Apdex score and/or page load times
- URL grouping
- Sessionization
- Filter data by release version, browser, version, geo-location, etc.
- Location-based heatmap
In addition to load times, Sematext Experience also records the loaded resources (images, fonts, stylesheets, javascript files) and the associated loading times. Interested in trying it out? Sign up today for a free exclusive beta invite by clicking here.

Top comments (0)