
Milan Bhardwaj is a colleague and an AI/ML software engineering adept with a wealth of experience solving real-world challenges with scalable solutions. He has driven many development cycles from inception to completion and wrote this expert and well-thought-out guide to remote debugging in IntelliJ environments.
Debugging is one of the most critical aspects of software development cycles. Developers not only leverage it to find and fix errors, but also to uncover potential performance issues in the code. Being able to debug is a core skill every developer needs to have in order to provide valuable, scalable solutions.
For applications running on remote servers and computers, developers turn to remote debugging to identify issues that can’t be produced locally. For example, you might run a smaller instance of your database locally to test with, but when pushed to a production load, bugs might surface related to large data sets. Or you might not run the same permission and firewall restrictions when developing locally that you do in production. This can lead to bugs that are impossible to reproduce locally without a significant investment in tooling.
With remote debugging, you can remotely control a target utilizing a debugger instance running on a different machine. The debugger instance, also referred to as a debug engine, runs on the same machine as the routine you’re debugging. Your local machine runs the debugger’s UI while the remote system runs both the debug engine and the target routine.
Remote debugging is particularly useful for a few reasons:
- Controlling the flow of execution: It’s vital that developers understand the context of a bug as it manifests, and remote debugging affords that with features like pausing, resuming, and executing the program step by step.
- Debugging in production environments: Troubleshooting problems on remote testing and production servers is no easy task. Running a debugger directly on the server where the application is running comes with its own set of limitations. Production servers usually run in strict environments where convenient developer tools are absent. Remote debugging is the perfect solution.
- Catering to multiple deployment scenarios: Developers can debug a variety of complex deployment scenarios, from a single, standalone application to distributed applications and clusters.
Debugging remotely in practice
Most programming languages support some kind of remote debugging with the right tooling in place. Java includes several options for remote debugging, including integrations with most IDEs.
In this tutorial, you’ll see how to set up remote debugging on IntelliJ so you can effectively debug applications deployed to staging and production machines when necessary.
Setting up remote debugging on IntelliJ
JetBrains’ IntelliJ is one of the most intelligent integrated development environments (IDEs), used by more than 62 percent of Java developers. It offers developers out-of-the-box Java debugging functionalities that facilitate efficient, sustainable solutions.
Creating a New Project and Class
The first step is to properly set up and configure your Java project in IntelliJ. If you have not set up a Java program before, read the IntelliJ documentation to understand how you can create and configure a new Java project.
In order to demonstrate remote debugging, create a new class. Click src on the sidebar, hover on New, then click Java class. For this example, we’ll create a class named My_Numbers.

Once you have created the Java class, it’s time to write some code. Populate the Main method with the below example:
public class My_Numbers { public static void main(String[] args) { System.out.println("Initiating"); for (int num = 0; num < 100; num++) { try { Thread.sleep(1000); } catch (InterruptedException e) { e.printStackTrace(); } System.out.println(num); } System.out.println("Done"); } }
This code is a basic example that prints numbers from 0 to 100. While it’s a simple example, it will be enough to showcase remote debugging without adding too much complexity. You’ll add a [(https://www.jetbrains.com/help/idea/using-breakpoints.html)debug breakpoint] in later steps.
Configuring Remote Debugging
Now that you have a Java project and test class ready, you need to set up a debugging configuration in IntelliJ. Navigate to Run, then Edit Configurations. Click Add New Configuration (+) and choose Remote JVM Debug.
Fill in the following information to describe your remote debugging environment:
- Name: In this case,
My_Numbers_remote_debug. - Host: This field is for the address of the machine where the host app will run. Since we’re running on the same server in this example, it should be
localhost, but if you want to debug a remote server (eg,192.168.18.46), you must enter the IP address here. - Port:
5005in this case. This port should be available, so pick one that your server supports. - Command-line arguments: You can copy the generated command-line arguments and paste them to the command line where JVM is active. You can copy the string for now (eg, -
agentlib:jdwp=transport=dt_socket,server=y,suspend=n,address=*:5005)and store it for later use.

Now IntelliJ knows where to access your remote (or local) application for debugging, but you still need to package and run the Java app to enter a debugging session.
Running the application
Set up the host application by packaging your application as a JAR and use the previously generated argument string directly in the command line.
<code><span class="hljs-keyword">java </span>-<span class="hljs-keyword">jar </span>-agentlib:<span class="hljs-keyword">jdwp=transport=dt_socket,server=y,suspend=n,address=*:5005 </span>remote-<span class="hljs-built_in">debug</span>-application-sample.<span class="hljs-keyword">jar</span>
</code>
Next, click Run, then Edit Configuration, then select My_Numbers from under the Application.

In Modify Options, select Add VM options.

Under the VM options field, paste the argument string that you copied previously.
With the necessary setup in place, you are ready to run the application. Right-click in the text editor and click Run My_Numbers.main().
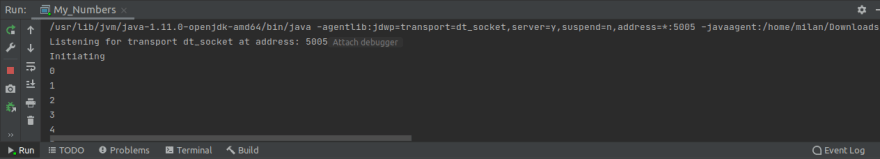
In the program output, you’ll see Listening for transport dt_socket at address: 5005, followed by your app’s output. The first line states that the debug agent is active and the program is ready to accept incoming debugger connections.
Adding a Breakpoint
Now that your Java program is running, you can add a breakpoint and attach it to the process. Breakpoints allow you to set a place in the code where execution will pause so you can inspect memory, variables, and the state of your program.
You can set a line breakpoint by clicking on the gutter at the line of your choice. For this example, click line 10 and set the breakpoint with the condition num = 50. The program is suspended as soon as the breakpoint condition meets the condition.

At this point, you can perform relevant debugging actions, including expression evaluation and stepping, among other tasks. These actions will work whether you’re running locally on your machine or connecting to a remote instance of your Java application.
There is no denying that with distributed applications, it has become easier to manage, scale, and divide the workload. However, the architecture makes it much difficult to detect/reproduce bugs since it’s challenging to trace anomalies back to the source or replicate complex production environments. Remote debugging with IntelliJ can help developers identify bugs and reproduce errors across every stage of the software deployment lifecycle.

Top comments (0)