Quick Tip — Using The Chrome DevTools FPS meter
One of the hidden gems in Chrome DevTools is the FPS meter. The FPS meter enables you to monitor frames per second during runtime. It’s very useful for animation monitoring and can help you to understand if you are running below 60 FPS.
How do you use the FPS meter? This is what this short post will cover.
Using The Chrome DevTools FPS meter
Open the Chrome DevTools and then open the Command Menu by using Control+Shift+P in Windows or Command+Shift+P in Mac. In the Command Menu, type ‘Show frames’ and pick the first option (should be “Show frames per second (FPS) meter”):

Doing this will open the FPS meter and you will be able to monitor your FPS. You can also open the Rendering tab and just check the FPS meter checkbox.
Here is how the FPS meter looks like:
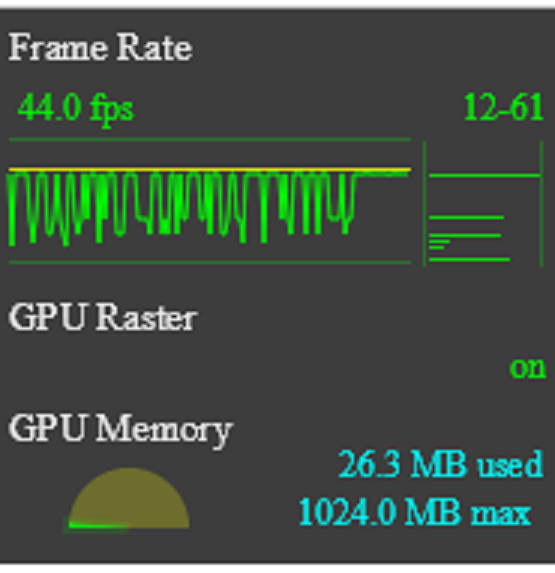
If your animation is running in 60 FPS then it should look smooth. Below 60 FPS means that some frame rendering is taking too long and the animation might not look smooth and may be even janky. Another thing that is shown in the FPS meter is the GPU memory usage. In the previous figure it’s 26.3 MB out of 1024 MB, which means low GPU usage.
After you finished your monitoring you can close the FPS meter. To do so, in the Command Menu search for ‘Hide frames’ and pick the first option (should be “Hide frames per seocnd (FPS) meter):

Another option is to open the Rendering tab and uncheck the FPS meter checkbox.
Summary
In this short post I showed you how to use the FPS meter in Chrome DevTools to monitor your animation FPS.

Top comments (0)