I have previously written about what happens when you don't await task-based methods. In this post I am going to show you the consequences of mixing blocking and async methods.
You have probably heard the mantra "Do not block when using async/await". Have you ever wondered why? This post will build on my Async Await, Deeply C# post and explore how to diagnose problems that arise from mixing blocking and async methods.
I should note that this post is based largely on Diagnosing thread pool exhaustion in .NET Core apps.
Now say we have a .NET 5.0 gRPC server application. All it does is send a streamed response to a gRPC call from a client. It was noticed that under load from many clients, the server response time started to increase significantly. Below is the result of the benchmark ...

Let's pretend that we haven't already suspected that we are mixing blocking and async methods. How do we even begin to figure out what is going on? Let's also complicate matters by saying that the problem only shows up in a production Linux server that doesn't have any GUI!
Thankfully Microsoft has realised that diagnosing problems on servers running in containers with no GUI support is a common enough case to require new tooling.
The first tool we are going to look at is dotnet-counters. A self-contained executable can be downloaded on to the server by running the following command ...
$ wget https://aka.ms/dotnet-counters/linux-x64 --output-document=dotnet-counters
$ chmod u+x dotnet-counters
$ pgrep Server # Server is the name of the process.
567832
$ ./dotnet-counters monitor -p 567832
Let's start with the case where the response time was reasonable (i.e. when the concurrent requests was 5). The output from dotnet-counters looked like this (note the GIF animation cycles) ...

Now let's have a look when the response time was problematic (i.e when the concurrent requests was 20) ...

If you noticed that the Thread Pool Queue Length was zero when there were 5 concurrent calls and maxed out at 20 when there were 20 concurrent calls then you get a gold star! A non-zero thread pool queue length suggests the thread pool doesn't have enough threads ready to handle the requests. The thread pool thread count is also increasing which indicates the thread pool is starting new threads in an attempt to service each request individually which hints that the threads are blocking up. Typically we would only need a few threads to service 20 requests - not 41!
Did I forget to mention that the server application code base is massive and it will be difficult to narrow down exactly where the problem is? Well there is another .NET command line tool for that called dotnet-dump.
$ wget https://aka.ms/dotnet-dump/linux-x64 --output-document=dotnet-dump
$ chmod u+x dotnet-dump
$ pgrep Server # Server is the name of the process.
567832
$ dotnet-dump collect -p 567832
$ mv core_202110803_154856 core_202110803_154856.dmp
Copy the dump file to a Windows machine running Visual Studio. Load the DMP file. Next in the "Managed Linux Core Dump File Summary" tab that is opened, on the right-hand-side select "Debug with Managed Only". Then select "Debug -> Windows -> Parallel Stacks". Make sure you have loaded your symbol PDB file. From this we can see 20 threads with the same stack trace ...
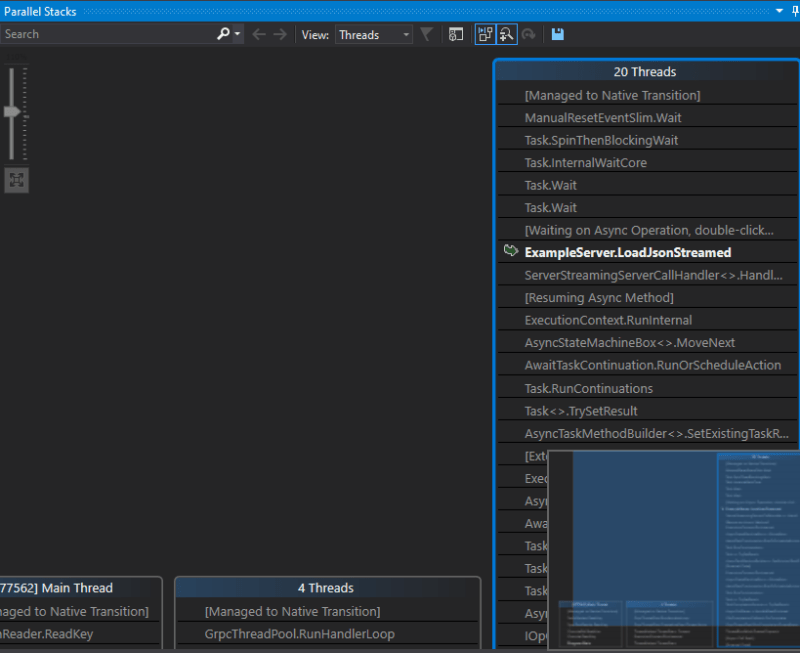
Clicking on the place in the stack trace where we notice our code we see ...

So it shows all 20 threads are blocked on a Wait(). Wait() is blocking and there is our problem! If we simply revise the code not to call Wait() but to await it instead, the benchmarks look much better ...


Top comments (0)