
Data analysis is a process of inspecting, cleansing, transforming and modeling data with the goal of discovering useful information, informing conclusions and supporting decision-making. Data analysis has multiple facets and approaches, encompassing diverse techniques under a variety of names and is used in different business, science and social science domains.
Salesforce Einstein
Einstein Analytics solves the challenge of combining all this information to answer key questions of your business users. It enables everyone in your org to get immediate access to powerful data insights through its intuitive point-and-click visual interface. It’s very easy to use as No need to wait for IT to wrangle data and create complex queries. No schemas need to be designed. No installation required.
Einstein Analytics is a self-service application that enables you to make sense of large amounts of data. You can explore your data to discover new, unexpected insights. Get instant visualizations that show how your business is doing, and even gaze into the future to see what the coming months might bring and create dashboards to continually monitor key business metrics based on the latest data. It designed to help you better understand your business and make data-driven decisions.
Einstein Analytics Studio:
Salesforce Analytics Studio is a built set of analyses and answers about a specific area of your business. It can provide curated paths through your data, plus powerful tools for spontaneous, deep explorations and can organize them in apps to present dashboards in relevant order and then share apps with appropriate groups.

Below is the provided Key features of Salesforce Einstein:
Dashboard
A dashboard is a type of graphical user interface which often provides at-a-glance views of key performance indicators relevant to a particular objective or business process. The dashboard is a curated set of charts, metrics, and tables that gives you an interactive view of your business data.
My Private App
This app is visible to you as a private. It’s an excellent place to store assets with sensitive data or work-in-progress dashboards that you aren’t ready to show others.
Shared App
Shared App is accessible by anyone in your org who has access to Einstein Analytics. It can still ensure stricter security on datasets through row-level security.
Lenses
A lens is a saved exploration. It can be combination of data analysis like top valuable customer, top rated industry or High Profitable portfolio.
DataSet
A dataset is a set of specially formatted source data, optimized for interactive exploration.

Einstein Analytics provides multiple ways to import data, both from Salesforce and external sources. For example, you can use an Einstein Analytics tool—like the dataflow or the dataset builder to import Salesforce data.
The dataset builder has a point-and-click interface. The dataflow enables you to perform more advanced tasks. To import external data, you can use the CSV Upload interface to import manually or the External Data API to import programmatically.
External Connector:
Salesfroce Analytics provides an internal Salesforce connector for data in your local org and a range of remote connectors for data in apps, data warehouses and database services.
Salesforce Einstein provides build in connector which will allow to connect with external source of data. Salesforce external connector syncs data from other Salesforce orgs as well.

Salesforce External
Salesforce Marketing Cloud Contacts
Marketo (Beta)
Microsoft Dynamics CRM
NetSuite
Oracle Eloqua
Eisntein provide feature to use these connectors to connect your data in external data warehouse services.
Amazon Redshift
Google BigQuery
Microsoft Azure SQL Data
Warehouse
Snowflake Computing
Salesforce Einstein can create a customer Einstein app as per requirement which allow organizing and controlling sharing of their datasets, lenses, and dashboards.

Go to Einstein Analytic Studio.
Click on Create button.
Select Blank App and Create Blank App.
Enter Name of the App.
Click on Create button.
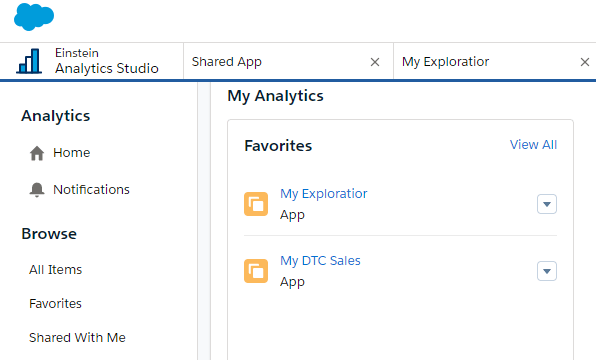
Einstein Analytics home page also has two areas that you can customize one for your favorite apps and one for tracking your notifications. You can set up notifications to track the progress of your goals right on your home page.
Click on All Item.
Click on the App tab.
Select the App to make as a favorite. Click Favorite.
Select multiple applications as per requirement.
Salesforce Einstein Analytics Dashboard:
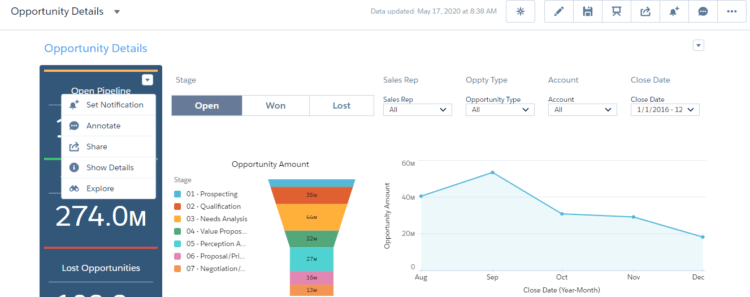
Salesforce Dashboard comes with multiple features and while running a dashboard in Analytics Studio, you can.
Edit the dashboard in the dashboard designer
Share from the dashboard.
Full-screen the presentation.
Open the notification panel and create notifications on dashboard widgets.
Open the annotation panel and annotate dashboard widgets.
Clone the dashboard in a new tab.
Save modified views of the dashboard.
Return the dashboard to its initial view.
Navigate to other dashboards and lenses in the app.
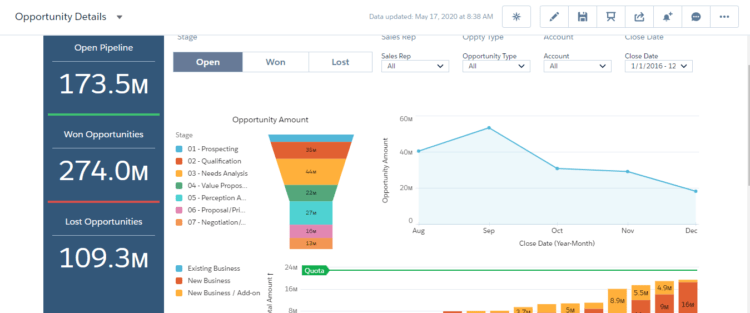
A dashboard is an interactive collection of widgets that show query results from your data, whether that data comes from inside or outside Salesforce. Dashboards tell a multifaceted story about your business from different angles. The Analytics dashboard isn’t just a static picture; it invites you to dig deeper into the underlying data.
It’s easy to filter data displayed in the dashboard by selecting from drop-down lists, switching toggles and clicking in charts. You can use Analytics dashboards to keep up with all the data. Your colleagues and customers are generating that. Track activities of sales, service, marketing personnel.

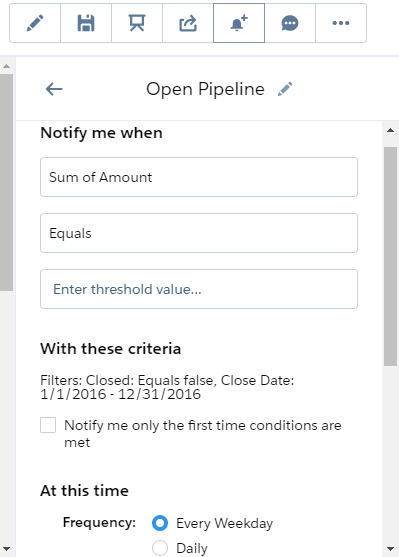
You can set the notification where the system will allow you to update with a System notification. Salesforce Provide a feature of notification for Dashboard.
Based on different conditions, the system will generate a notification.
In the notifications panel, select Equals or is less than from the second drop-down menu and enter the threshold value. Based on value, a notification will be fired once cross the limit.
If you wanted automatically receive your email notifications, you could click Edit Recipients and add users who have access to the dashboard.
You can also define tracking the dashboard on home page by making condition true for the notification property.
Sharing
Someone in the meeting asks about sharing the dashboard with one of the other sales teams. They might have another idea about it. In the resulting dialog, there are tabs for different actions. You can set up sharing options, post a dashboard screenshot to Chatter, get a URL to share or download a screenshot.
There are multiple options available wherewith the different way data can be share.

We can also share the details about the dashboard on the chatter.
An analyst asks about the customer behavior and demographic data the team has been keeping in Excel. If the analysts can access the raw data and add it to theirs, perhaps they can get a handle on the results looking at. It allows you download filtered data from a widget. It just takes you a couple minutes to show everyone how to get the data out of a widget and into a CSV file the team can use.
Salesforce and external data into Einstein Analytics so you can analyze it all at once.
Build dashboards that provide cool visualizations based on that data.
Explore data using Einstein Analytics dashboards to answer questions about your business, and discover answers to questions you didn’t know you had

Permission Set
Based on a permission set and profile defect set of data access can be give to the user. Select the permissions you want to assign from the specific permissions enabled by the Permission Set and add them to the permission set. If you instead want to provide full permissions for users to access Einstein Analytics feature.
An Einstein Analytics platform license includes two default permission sets, Einstein Analytics User and Einstein Analytics Admin. The user permission set includes a single permission: Use Analytics. The admin permission set includes the broad range of user permissions needed to build an Einstein Analytics solution.

Features:
Different users have different needs. Some want to work with the API, some want to share with Communities, and others want to be able to download their Einstein Analytics explorations. As the Sales force admin who sets up Einstein Analytics, you want to use all these features.
Show or Hide Data- You can enable or disable that feature, depending on whether you have content you want shown all the time. row-level security applies to the dataset used by a lens or dashboard, the preview thumbnail can expose data from restricted rows.
Go To Setup
Search Analytics and navigate to Setting.
Select Show preview thumbnails for secure lenses and dashboards and save.

Enable or Disable Downloading from Einstein Analytics.
You can redistrict the user or give the user permission based on the configuration to allow downloading. Some of the companies have critical data, and they don’t want to permit the user to enable downloading data or don’t want to take the chance to leak the information will use this feature.
Go to the profile and remove the profile level access for all the team members.
Create a permission set and select the Download Analytics Data flag as Y.
Assign this permission set to the user where permission needs to provide.
Feed Tracking
Dashboard can be shared in the conversation with the use of annotation. We can add notes to dashboard widgets, with comments posted in the dashboard, and in Chatter. With annotations, your users can hold more productive conversations about data and how it’s visualized because the dashboard is right there for reference. Einstein Analytics dashboard annotations are naively integrated with Chatter.
This feature can be enabled and disable with the help of Feed Tracking property.
REST API Access
API allows to automate the things or application accessible can be increased with the help of API solution. By selection of setting to override the API Enabled permission, permission can be granted.
Go to setup, Search Analytics.
Go to Setting.
Select Grant all users access to Wave API.
Save Record.
Security:
Einstein Analytics users have access to a dataset; they have access to all records in the dataset. Sometimes you want to implement row-level security on a dataset to restrict access to certain records as some records contain sensitive data that shouldn’t be accessible to everyone.
You can set a predicate for each dataset where you want to restrict access to records. Einstein Analytics checks the predicate to determine which records the user can access.
Go to Data Set.
Click on Edit button.
Go to the Security section.
Give the predicate permission filter.
Dashboard Design:
When you create a dashboard, you can start from scratch or use a template. Templates provide the heavy lifting for you. Templates come with an industry-proven design and suggested widgets. It contains several widgets that you can use to track key performance metrics. It contains selectors that let you change the filters while viewing the dashboard—you don’t need edit access.
Let’s create this dashboard.
Go to Analytics Studio.
Click on create and select Dashboard.
Create Blank Dashboard.
Drag and drop the left-hand toolbar into the panel.
You can select the data set which we want to display in a dashboard format.
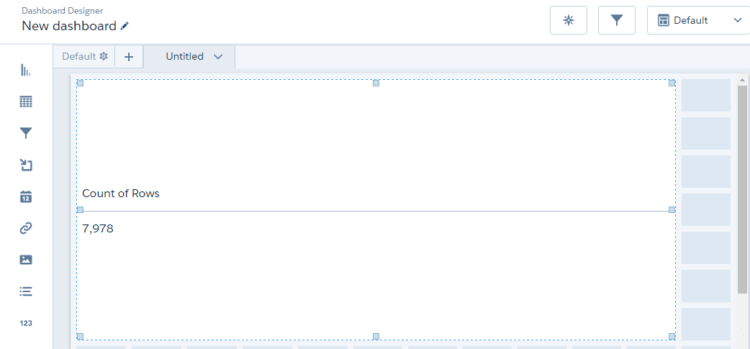
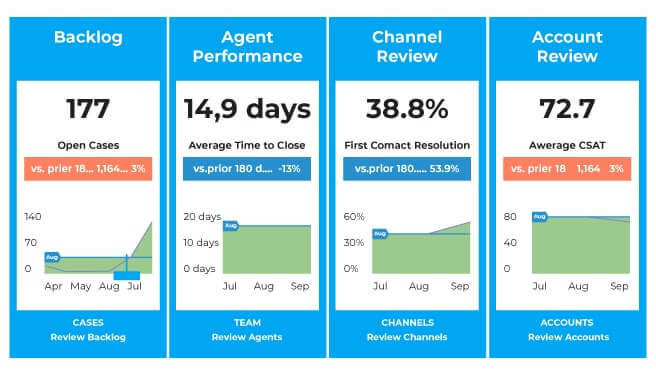
One of the key purposes of a dashboard is to give you quick insights into your business. That usually means providing key measurements of your business.
Such as the following:
Total number of deals.
Average deal size.
Average case resolution time.
CSAT score.
Charts, visualize your data so you can quickly get summaries, make comparisons, and identify trends. When you need a close-up view, tables provide you with record-level details.

You can add multiple global filters in a global filter panel widget. Use a global filter to apply the same filter to multiple queries in the dashboard. You can specify which queries to apply the global filters to and enable the users to change the filters while viewing the dashboard.
Mobile Layout
You can create a new layout for mobile devices. While the default layout you’ve already created works on all devices, including smart phones and tablets which isn’t optimized for smaller screens.
Navigate to the Sales Performance dashboard and edit record.
From the layouts menu, select Manage Layouts.
Create a Mobile Layout and provide the name of Layout.
Save the record.
You can customize your mobile layout by choosing your widgets and their placement; you can create a whole new layout that looks great on a small screen.

Now that you have multiple layouts for your Sales Performance dashboard, Analytics needs to choose which one is best for your device. If there’s more than one eligible layout, the most eligible one is chosen that is, the one with the most device properties set.
Analytics apps give you actionable analytics with ready-made dashboards that are automatically populated with Salesforce data. With minimal setup, they provide best-practice dashboards that show you key performance indicators. It shows you the state of your business using the data you already have in Salesforce and they can help you turn that data into smarter actions to accelerate new business.
Salesforce Einstein Life Cycle:
When you use the wizard, it asks you a series of questions about your data. Your answers tell Analytics how to present data in the dashboards it creates for your app. That means you can create an app multiple times quickly with different settings until the app works just the way you like. Apps make it easy for you to explore your data without knowing what you’re looking for first. Analytics apps do most of the work for you by building dashboards that let you get answers about key aspects of your business.
Create the app using the default answers in the wizard wherever possible just to see what it looks like.
Let’s create an App.
Login to the application and select Analytics Studio.
Click on Create Button and Select App.
Select Start from Template.
Select the template and continue.
Select any one option out of two options: Basic, which uses the default settings to create the app, and Custom, which lets you go beyond the defaults and choose your own settings.
Click next and after completion of the wizard it will give the name for the new created Application.

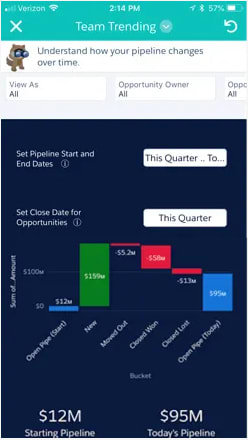
The app anticipates the way you likely want to manage and analyze sales processes and data. It provides dashboards targeted to meet the analytics needs of three key roles in your sales team:
Sales managers. Start with an overview dashboard to show your team’s KPIs in a single place. Then, follow links to details about the pipeline, team productivity, quota progress, and new business sources.
Sales operations staff. Get key insights from dashboards, highlighting sales performance and other operational KPIs.
Analytics gives you a great way to integrate with multiple data sources so you can look at all your data in one place. To get your data from the external tool into the app, follow a necessary two-step procedure:
Assemble quotas data into a plain CSV file.
Import the data into a dataset called Quota.
It support CSV files not .xls files. The CSV file needs to include the following fields, with those specific column names in this order, or the app can’t import it:
Let’s take an example of the Quote data import.
Quota Amount- the amount assigned to each team member.
Start Date (in yyyy-mm-dd format)- the start of the period you want your team to reach its quota.
Owner Name- the name of the team member. This is the user’s Full Name in Salesforce.
Username- the team member’s Salesforce User ID.
Header- It also needs to include a header identifying each column.
Salesforce provide Trailhead Data Manager Page if you are trying to work of Dev Org.
Go to App Launcher.
Select Trailhead Data Manager
Click Quota Data circle and then click Download Quota CSV.
It will work like import data to the real time Salesforce Einstein Application.
Salesforce Einstein provides the facility where created new application can be share with others in case data needs to share with anyone.
Open application.
Click on Share item icon.
Add Invite others option here you can provide other user id of the sales force where you wants to share the application.
Select the option as viewers which allow giving permission for view only, it will not allow to, edit the report.
Click Add, then click Save.
Salesforce provide a complete solution for the mobile an Application is listed on android and app Store for the mobile user.
Go to the App Store.
Search for Salesforce Analytics.
Tap get to install the app.
Tap the Analytics icon to launch the app.
Accept the License Agreement, and then take the walk through on the main concepts of Analytics.
Tap the icon in the upper left corner to open the account screen.
Tap Add New Account
Enter credentials.
Allow on the permission request page.
Salesforce Einstein Service Analytics
The Service Analytics app makes it easy for your entire service team to base their actions on insights drawn from Service Cloud data. You get access to best-practice key performance indicators in a single place. Service Analytics provides dashboards for both you and the manager and your service agents. Every member of the service team gets the right information at the right time to keep customers happy.
Managers have a complete view of service customer data, trending, and historical and peer benchmarks.
Salesforce built complex queries, formulas, and ratios drawn from service and sales data and assemble the information into easy to read visualizations. Its pre-built datasets and dashboards to explore Service Cloud data from any device that supports the Einstein Analytics platform.
Service case Management can be an essential part of the Salesforce Service process. Salesforce has provided a wizard where based on object selection, different specific functional applications can be created.
Go to Analytic Studio.
Click on Create and select App.
Select Create App from Template and click Create.
Select template. Click Continue.
Click on Looks good, next.
Select Custom, and click Looks good, next.
It will display set of question where focused on case metrics.
♦ What primary field do you use to track case duration? Leave blank if you don’t have a custom formula field for duration.
♦ What other case duration measures would you like to include?
♦ What field do you use to track whether cases are within the bounds of an SLA?
♦ Which field do you use to track first contact resolution?
♦ What month starts your fiscal period?
These all are important to set the behavior of the application.
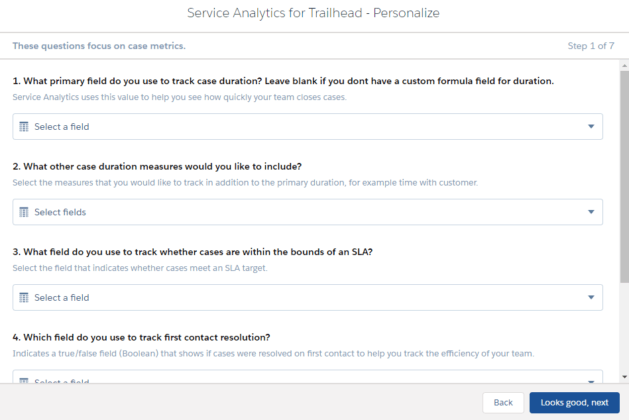
Click on Next button.
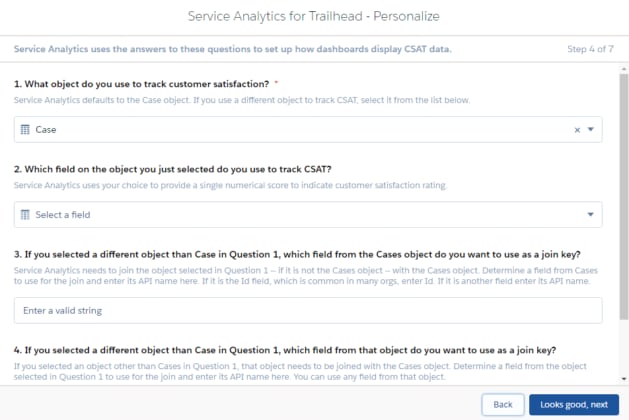
In the next steps it will ask set of questions which is important to provide other set of important information of the application. Otherwise our dashboards fail and don’t show data about customer satisfaction correctly.
set of questions
♦ What field do you use to track the status of case?
♦ What field do you use to record the type/level of support customers are entitled to receive?
♦ What field do you use to categorize case severity?
♦ What field do you use to identify the product associated with the case?
♦ What field do you use to identify the case reason or topics?
♦ What field do you use to identify the case type?
♦ What field do you use to identify the origin or channel of the case?
♦ What object do you use to view data by geography?
♦ What field do you use to view data by geography?
♦ Do you use the record type field to distinguish your cases?
♦ Do you assign ownership of cases to queues?
Provide what is the maximum time service agents should keep customers waiting during a call.
Provide Application name with which name wants to save the Application.
You can also sync the data from the application to prepare dashboard and report using Salesforces Einstein Analytics.
This app’s dashboards gave you quick insights into how your team’s doing and where you needed more, you took action right from the dashboards. The app boosted your confidence in your team’s ability to make the tablet launch a success. It can also perform a set of tasks.
Clarify the data.
Make data actionable.
Make data contextual.
Set benchmarks.

Let’s take an Example – Dashboard report can be a divide in the bucket field based on that data can be categorized.

Data Expert:
Dataset is a box of data. Salesforce is a hexagonal purple box. A dataset can contain data from a single Salesforce object, such as opportunities. Or it can contain data combined from different objects, such as opportunities, accounts, and users, and data from external sources, such as financial data. You can also create a dataset by combining data from other datasets, each in turn containing data from multiple sources and datasets.
Salesforce data is normalized, which means that related data in different objects is joined together. When you run a Salesforce report, the report engine has to pull in data from these objects as it assembles the report.
Analytics datasets allow you to combine such things as your Salesforce opportunity data with financial, quota, or demographic data from another system or source. This type of data combination is impossible with a Salesforce report without doing a ton of work with custom objects.
There are two main stages in creating a dataset: extraction and preparation. Extraction, as painful as it can sound, is simply the process of bringing data into Analytics. Preparation involves getting that data into a form that’s meaningful to the people exploring it. To compare the process to cooking, extraction is taking the ingredients from your cupboards, and preparation is putting them together.
When you identify data requirements, think about what data you need, where it’s located, and if it needs to be combined with other data.
Plan the Data Journey :
Identify Your Data Requirements – Identify the data which you want to process as per the requirement.
Map the Data Journey- The act of mapping the data journey breaks down the process into a series of steps for you to follow. Use the CSV upload to extract them. The remaining data is all in Salesforce, so you use the data flow for these. You can do this in any order, as long as all the data is extracted before you get to the preparation stage.
When you extract data from a CSV file, Analytics makes assumptions about what type of data it is, based on the values it sees in each field. It assigns each area a kind of measure, date, or dimension.
Custom Map
Analytics has built-in map charts of various geographical areas. You can use them like any other chart to display a visualization of your data. Custom maps are based on a standard GeoJSON definition file that contains metadata and coordinates for drawing the map. Analytics can read the GeoJSON file and display the encoded map as just another map chart.

Event Monitoring Analytics
The Event Monitoring Analytics app makes it easy for you to base your actions on insights drawn from data. Event Monitoring Analytics pulls its data from Salesforce event logs. Event Monitoring Analytics provides dashboards for both customers and the Salesforce admin and for the users. This app helps you drill into org’s data and swiftly identify suspicious behavior, slow page performance, and poor user adoption. Salesforce built complex queries and ratios that draw from event log data and assemble the information into easy to read visualizations.
After the app is generated, use its prebuilt datasets and dashboards to explore Event Monitoring data from any device that supports the Analytics platform.
Below is the step to setup event monitoring configuration.
Go to Setup.
Search event and click on Event Monitoring Settings.
Select View Event Log Data in Analytics Apps.
Assign a permission set specifically for executives.
Event Monitoring Analytics Admin– Users who create and customize Event Monitoring Analytics apps and data flows.
Event Monitoring Analytics User- Users who view Event Monitoring Analytics apps.
Scheduler:
Scheduling is the method by which work is assigned to resources that complete the work. The work may be virtual computation elements such as threads, processes or data flows, which are in turn scheduled onto hardware resources such as processors, network links or expansion cards.
When you created your Event Monitoring Analytics app, you manually started the dataflow. You can schedule the dataflow to be rerun every day. Salesforce recommends running the dataflow between 8:00 and 9:00 AM to make sure that you start your day with refreshed dashboards.

Go to the gear icon in the upper right, and select Data Manager.
Select the Data flows sub-tab.
Select Data flow.
Open the menu.
Select Schedule and set the time.
Select the days when it needs to execute and save the record.
Salesforce Einstein increases your team’s productivity, enables you to make informed marketing predictions and helps you discover insights. It also offers a smart app building. Salesforce Einstein empowers sales agents to become effective.
With the help of Einstein, Marketing Cloud will have more accurate data. Einstein Engagement provides a singular dashboard where users can assess subscriber engagement and do the prediction.

Top comments (0)