
The success of an agile development process lies in achieving targets and completing the tasks within the specified time. Meeting goals consistently not only help streamline the development process but also helps optimize productivity and improve customer satisfaction. To complete tasks within the deadline every time, managers should understand the team's potential by leveraging data from previous sprints and setting up realistic targets. Even remote scrum teams uses sprints for carefully orchestrating their next monthly and quarterly goals. Setting this target early in the development circle allows everyone involved to have a fair expectation of the deliverables. And the most effective way to do this is by calculating the sprint velocity and leveraging the generated insights to streamline outcomes.
What is Sprint Velocity?
Before we get to the specifics, let us start at the roots. What exactly is a sprint? The agile development process is divided into various iterations and cycles. Each of these cycles is called a Sprint, which is a fundamental component of the agile development framework. Calculating the number of tasks a team can complete within a sprint gives us sprint velocity. Tracking the sprint velocity helps managers configure the number of tasks their team can take up and complete within the deadline. Sprint velocity is subjective and varies across teams, projects, and sometimes even clients.
How to calculate Sprint Velocity?
Sprint velocity is calculated by dividing the number of tasks completed in the previous sprints by the total number of sprints. In other words, sprint velocity is the average number of tasks or hours logged in to complete a particular sprint. There are two ways to calculate sprint velocity.
Calculating Sprint Velocity Using User Story

A user story is a small informal writeup detailing features from the customer's perspective and can be used as a unit to calculate sprint velocity. In this scenario, let us consider three sprints as sprint velocity is an aggregate of the previous sprints.
Sprint 1: The team had initially planned to complete 10 user stories in this sprint but were able to achieve only 8.
Sprint 2: The team planned for 8 new user stories, and took up the 2 over from the previous sprint. So, in Sprint 2, 10 user stories were completed.
Sprint 3: The team planned for 6 new stories and achieved their target.
The first sprint struggled to complete its target, while the second sprint experienced a tremendous workload. In comparison with its predecessors, sprint 3 achieved its predefined target. So, if we had to calculate the sprint velocity:
No. of tasks - 24
No. of sprints - 3
Sprint Velocity: No. of tasks/ No. of sprints = 24/3 = 8
Advantages of Using Sprint Velocity
As mentioned earlier, sprint velocity helps in setting a realistic target and achieving it. This takes the pressure off the team in consecutive sprints and also saves them from the fear of underperformance. Consistently not achieving the target or dealing with the overloads could deter teams from performing and lead to developer burnout while missing client deadlines. Here are the other advantages of calculating the sprint velocity:
Sprint velocity is a crucial metric for understanding the workflow, and assigning achievable deadlines to teams.
Calculating sprint velocity also helps managers incur insights into the team performance and set benchmarks.
Since sprint velocity is a product of past data, it is reliable and can be personalized.
Tracking sprint velocity patterns allows managers to define and create optimized product roadmaps and make informed decisions on project allocations.
The easy calculation also makes it easy to adopt and refer for better one-on-ones with the team and augment resource utilization capabilities.
Tips to Increase Sprint Velocity in an Agile Project
Managers can devise strategies to achieve the best sprint velocities for the team. However, enthusiasm should not come in the way of fixing a sprint velocity that might seem easily achievable. Here are tips to increase sprint velocity:
Craft user stories that are crisp, concise, and to the point. Avoid beating around the bush or being too complex.
Maintain a consistent team size throughout the sprints sunless there is an absolute need to add or reduce members. Sprint velocity is a team goal.
Building on the previous point, the entire team should huddle up and understand what they are collectively working for. Better collaboration and communication can ensure work is simplified and made aware of.
Managers need to host effective standups and leverage the platform to understand progress. Consistently holding these standups provides no room for jumpscares or surprises.
Stand-ups also uncover the blockers faced by the team and help take remedial measures fast.
Never prioritize quantity over quality. Due to the need to achieve better velocity numbers, teams sometimes tend to look past mistakes - big and small, to ensure completion. This practice only makes things worse in the long run since mistakes call for reworks that can compromise deadlines.
Every team targets more releases and fast releases. But they should also ensure ample time is available to test and make changes. This ensures the testers are not put on the spot, and that reworks do not impact the quality. Ensure there is enough time to test and make changes.
Teams should adopt the practice of including stabilizations sprints to provide the time for one final inspection and clean-up. Including stabilization sprints enable advanced delivery along with quality.
Optimizing Team Sprint Velocity using Hatica
Hatica leverages its built-in metrics and seamless integrations to calculate and generate actionable insights into the sprint velocity metric effortlessly. The platform also caters to all four stages of a sprint, namely - Planning, Execution, Review, and Retrospective, with the numerous engineering tools in its arsenal. Here is how Hatica calculates and boosts sprint velocity calculation:
Data-Driven Sprint Planning
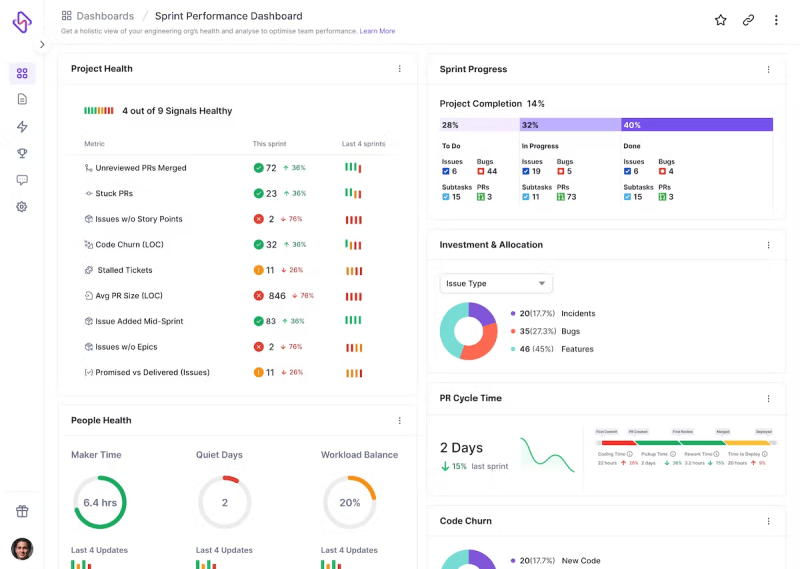
Hatica provides a comprehensive view of the engineering team's velocity with built-in cycle time metrics that enables managers to track the end-to-end cycle time. Hatica integrates and accumulates data from project management tools to equip managers with insights into the team's workflow to set relevant targets for a data-driven process cycle.
Hatica’s sprint performance dashboard defines the project health across metrics, along with comparing data across the past four sprints so managers can find the foundational blockers of their teams. Moreover, the insights are not just limited to project updates, but carefully collates the personal experiences of developers while they work on the project through measuring maker time and workload balance on each individual. The insights of the past sprints helps engineering managers to refine their upcoming sprints and project deadlines, so they don’t seem unprepared for unwarranted, random blockers.
Resource- Optimized Sprint Execution
Hatica's DevOps dashboard is based on Google’s proven DORA metrics to enhance team efficiency and plug bottlenecks. The dashboard numbers also helps engineering managers identify their place in the DevOps maturity scale- top, medium, elite or low performers. With Hatica, similar engineering insights are possible while ensuring timely execution, quality and feedback for ongoing sprints.
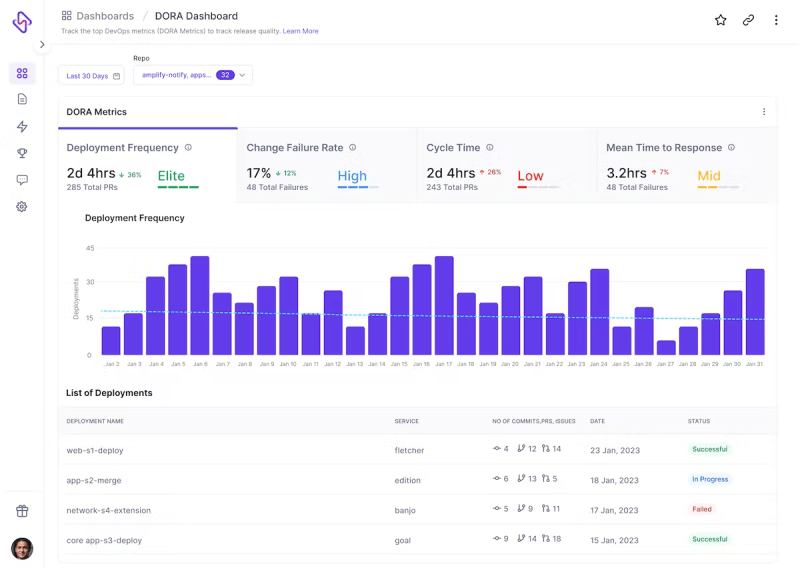
Hatica helps build an optimized CI/CD pipeline by providing data into the various stages of building, testing, and deploying. The option to evaluate code and provide reviews also ensure feedback is provided and implemented at different stages of the development process, resulting in better sprint velocity.
Analytics-Based Retrospectives and Reflections
Retrospectives determine the real results of how well a sprint has performed- goals achieved, stalled, and blockers faced by team members. However, retrospectives are not just about task checklists, but also includes a healthy discussion on tools, processes, and feedback involved. With Hatica’s engineering analytics, managers can add actionable insights to what hampers their developer velocity, and creates a discussion around finding long-term solutions.
The cycle time metric provides an in-depth view into the development workflow at a granular level and provides analytics on time spent in coding, review, and rework, thus helping identify time spent across the various sections and the means to optimize them. Hatica also enables managers to track the code churn rate of their teammates to understand and uncover bottlenecks in the software development process.

At the end of sprint retrospectives, managers also might want to see the workload distribution amongst team members for better allocation in the next phase. Hatica’s effort allocation helps engineering managers to get a 360 degree view of what their engineers have worked on, and how much work to assign an individual so they don’t get burnt out.

Hatica's dev dashboard enables managers to calculate sprint velocity while improving developer productivity throughout the software development cycle.
Closing Comments
Sprint velocity is a crucial metric in agile planning that provides a comprehensive overview of the team's performance, efficiency, and commitment to deliverables. Hatica not only helps calculate Sprint Velocity, but its added metrics ensures engineering managers have a right understanding of what’s going on with their team members. The dashboard makes it seamless to adapt, work with, and implement these dev metrics.
Check out how Hatica helps teams in raising their sprint velocity by scheduling a demo today.

Top comments (0)