Trendcast - Demand Forecast for Fashion Retailers
Exploring the Impact of Weather on Short-time Demand Forecast for Fashion Retailers.
OurDashboardpredicts the inventory requirements with the help ofpast salesand real-timeweather forecast
Watch the project video here -

The Pipeline -
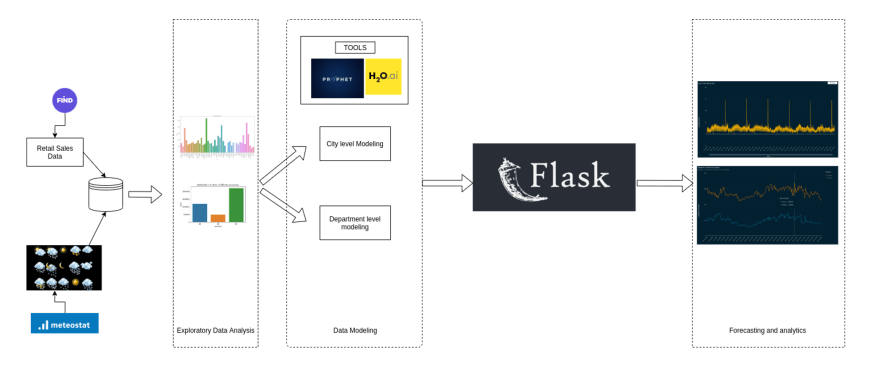
Data Collection:
The pipeline incorporates datasets from two sources to solve the problem:
Retail Data: A historic time-series dataset containing six years of retail sales transactions. The dataset was hierarchical in nature containing: Date of purchase → Province → City → Category → Department → Class → Style → Quantity of items sold and Total sales.
Weather Data: I fetched the weather-related information like min temperature, max temperature, precipitation, snow depth, wind speed, etc, for corresponding dates and cities in the retail data from Meteostat using their Historical Weather API.
Extraction, Transformation and Loading [ETL]:
Data integration was performed at two levels, city and date. After combining the two data sources, the following ETL steps were performed.
Weather features with more than 80% null values were dropped since interpolating them would lead to incorrect and biased data.
Other missing data in weather was filled with interpolation using the nearest matching assuming that the weather would not vary a lot in small time-frames.
Missing data in the retail sales records after integration was filled with zeroes assuming there were no sales that particular day.
Exploratory Data Analysis [EDA]:
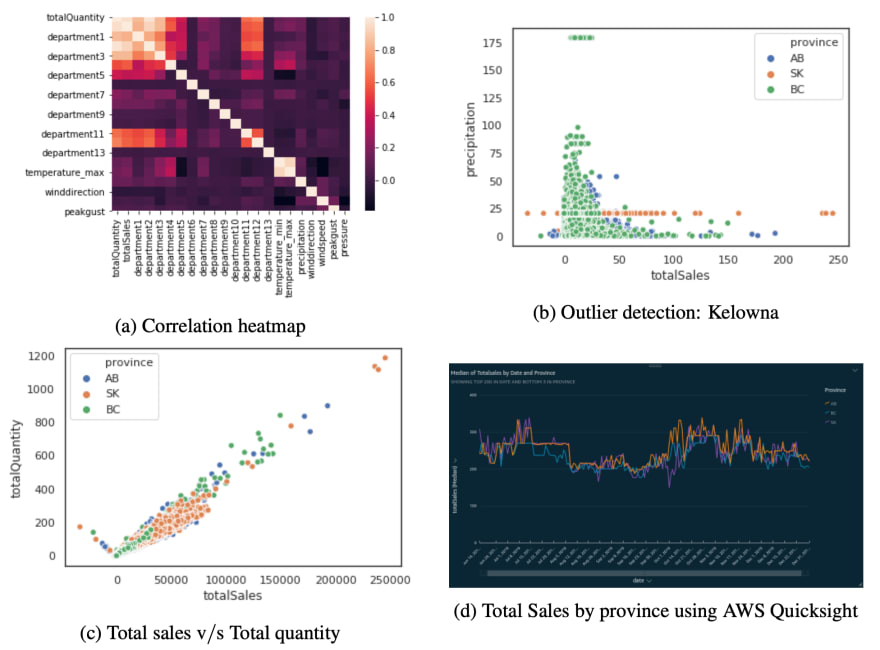
For the initial EDA, AWS Quicksight was used to have an initial overview of the dataset. After this, I explored the distribution of the features to measure the skewness, cardinality and frequency distribution of the unique features in the feature vector.
After basic EDA, I tried to find multiple feature interactions with each other for which I made a heatmap visualizing the correlation of features using Matplotlib and Seaborn.
Data Modeling:
A Stacked Ensemble was created which is a technique where data is trained on base learners and then predictions from those models are fed into a meta-model which then predicts the final values.
In this implementation, I used random forest, extra trees, AdaBoost and gradient boosted trees regressor as our base learners or level-0 models. XGBoost was used as the meta-model or level-1 model which was trained on the predictions of level-0 (base learners).
I was able to achieve an RMSE of 0.08 and MAE of 0.11 with this approach.
Visualization
Once the model files were generated, Flask was used to create a front-end dashboard for the end-user. The user has the ability to choose the City and the Department for which he wants to view the predictions. The application then identifies the date of the latest transaction from the dataset and then calls the weather API to get the weather information for the upcoming week. This information is then fed into the appropriate model and the predictions are displayed on the dashboard using ApexCharts.js.

Future Notes
This project showed that the weather does have a modest impact on retail sales for some cities and classes of departments. Future analysis could work on modelling on the granular level of data such as style and class, which would give even more accurate forecasts regarding the items needed to stock for the coming week. In this project we focused on an ablation study, to analyze the impact of weather. A statistical approach to understand the causality of weather such as the Granger-Causality test could also be applied. The forecast horizon could also be extended for reliable predictions in future studies.
Project source -
 inderpartap
/
trendcast
inderpartap
/
trendcast
From supply-chain to marketing, weather-related changes have impacted how retailers do business. This project helps fashion retailers better manage their inventories through our short-term demand prediction including weather as an influencing factor.
Welcome to Trendcast 👋


Exploring the Impact of Weather on Short-time Demand Forecast for Fashion Retailers.
OurDashboardwill predict your inventory requirements with the help ofpast salesand real-timeweather forecast

✨ Demo
Go to the app folder and run:
python app.pyMake sure to install the requirements before you start the flask app.
🚀 Development Setup
Clone the repository:
git clone https://github.com/inderpartap/trendcast.gitInstall the application requirements in a linux environment:
pip install requirements.txtMake sure to add a retail dataset in the data folder to start working.
Columns used in our the dataset are (date, province, city, category, department, class, article, totalSales, totalQuantity)That's it. You can now start contributing to the project.
Code Contributors
Thanks to the following people who have contributed to this project:
-
@inderpartap
🎨 💻 -
@najq
📹 💻 -
@pallavibharadwaj
📆 💻 -
@THEMrinaal
🔣 💻
🤝 Contributing
Contributions, issues and feature requests are welcome…

Latest comments (1)
I can recommend a guaranteed website where you will find unique and useful discount coupons for various products. It is enough to activate these items before paying and there will be a certain discount with a different discount amount. In addition, you are guaranteed to receive cashback from each purchase. This is a great advantage. tobecoupon.com/ TobeCoupon