As a developer, when I find myself doing the same task over and over, I take a step back and consider automation. That is the well known DRY (Don’t Repeat Yourself) principle.
By taking the effort, you might end up fixing other issues along the way.
Keeping visualisations and code changes in sync, it’s been one of the most annoying things since I started working with microservices, AWS Lambdas and Kibana.
Because of that, I have created logger-to-kibana. An open source project that tries to help solve that problem.
The idea
logger-to-kibana aims to parse your source code and generates basic, but useful, visualisations.
You should be able to just stick it into your deployment pipeline and that should keep those basic visualisations up to date.
There are plenty of tools out there to ship and format your log messages. This tool assumes your logs are in Elastic/Kibana.
Let’s now look into an example:
Example
This piece of code:
import logging
from datetime import datetime

LOG = logging.getLogger()


def lambda_handler(event, context):
    LOG.info(‘lambda_handler called’)
    return {’message’: datetime.now()}
Assuming that you have a message in Kibana with a message object and the content as “lambda_handler called”.
logger-to-kibana will find the message and generate the following visualisation:
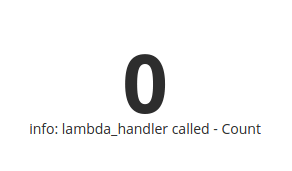
Visualisations are grouped depending on the sub-folder, filename and function.
Finally, it generates a dashboard with all the visualisations.
Configuration
You need to follow the next steps in order to get this working.
Install logger-to-kibana from pipy
pip install logger-to-kibana
Then run:
logger-to-kibana process_generate_and_send -f <folder>
That will process all the files under <folder>app/src/**/*.py, parsing them using RegExp looking for the different log messages in the files.
Check the README.md#how-does-it-work to find more about how does it work. You can also find details about how to change it for your own needs.
As pointed out before, it splits/group the messages by sub-folder, filename and then function, and generates a metric visualisation for each group.
The dashboard with all visualisations generated will have the top folder name (that typically is the project name).
Closing notes
The main goal was to help identify issues in the code by having visualisations, but it’s already bringing a few extras:
- Identifying poor, or even duplicated, log messages
- Improving consistency of log messages
- Synchronising code and visualisations
- Documenting the logs generated by your code
Ideally, the program will choose the best visualisation depending on the amount of data (and maybe type), but implementing that might take a while.
I will take the aproach of generating visualisations in other systems like cloudwatch and/or graphana. If that happens maybe I need to change the name to logger-to-graph or something like that.
What next
I will start by explaining the build process. As I have mentioned at the top, I hate repetition and try to embrace automation. Lets start with the CI/CD and how I have archived, in my opinion, a fairly good level of automation in that front.
But I will take a wee break as I have already done enough for today. More to come!
You can also pop along and help contribute into the project. ;)
 IsmaelMartinez
/
logger-to-kibana
IsmaelMartinez
/
logger-to-kibana
Parse loggers in your code and generate a kibana visualisation with them
logger-to-kibana
This project is inteded to generate view from the log messages encountered.
The python executable can be found in https://pypi.org/project/logger-to-kibana/
You will need to install the dependences by running
pip install -r requirements.txt
To get the programs help just type:
python main.py
This returns:
  Usage: main.py [OPTIONS] COMMAND [ARGS]...

  Process the file provided according to conditions

Options:
  --help  Show this message and exit.

Commands:
  pommands:
  process                    Process the folder
  process_and_generate       Process the folder and generate visualization
  process_generate_and_send  Process the folder, generate visualization and
                             send
I have created a dev.to series explaining how this project works and any learning that I have taken from doing so. You can find it in https://dev.to/ismaelmartinez/setting-up-my-first-opensource-python-project-4k1o
Default settings
The default settings can be found in the settings.ini file. You can provide a different settings file by specifying it as an environment variable LOGGER_TO_KIBANA_CONFIG
commands
The current available commands are:
process
Process a folder and…

Top comments (0)