In a previous post, machine-learning-groovy.html (spanish), I was playing to group similar customers using Groovy + Ignite.
To be honest, although it works, I think the script is very obscure, so I was looking for another approach, and I’ve reached Spark. In this post, I’ll cover the same issue but using it but using local mode I mean, I’ll not use many nodes as my data is a small files with 1000 records +- and can suite on my computer
To recap:
We have collected different features of our customer as number of users, number of documents finished, time to complete, web or api, and so.
As our main data comes from a big MySQL database, we have created a "feature" table fed with several "groups by", so we have something similar to
| CustomerId | Users | Finished | Days | API | Web | … |
| 1 | 2 | 21221 | 22 | 2212 | 18000 | … |
| 2 | 1 | 221 | 2 | 21 | 200 | … |
Project
This time I’ll use a gradle project (you can use Maven also) instead a GroovyScript. I founded some problems with Ivy downloading dependencies, so I decided to create a project with only 1 class (yes, I know, I know …)
build.gradle
dependencies {
    // Use the latest Groovy version for building this library
    implementation 'org.apache.groovy:groovy-all:4.0.11'

    implementation 'mysql:mysql-connector-java:5.0.5'
    implementation 'org.apache.spark:spark-core_2.13:3.5.1'
    implementation 'org.apache.spark:spark-mllib_2.13:3.5.1'
    implementation 'org.apache.spark:spark-sql_2.13:3.5.1'

}
java {
    toolchain {
        languageVersion = JavaLanguageVersion.of(11)
    }
}
(Java version 17 doesn’t work with Spark)
Features
We’ll define a correlation map between "visual labels" and mysql column:
def labels = [
    'Users' : 'nusers',
    'Documents': 'ndocuments',
    'Finished' : 'docusfinished',
    'Days' : 'daystofinish',
    'API' : 'template',
    'Web' : 'web',
    'Workflow' : 'workflow'
]
And we’ll generate a CSV file:
def rows = mlDB.rows('select * from ml.clientes order by nombre')

def file = new File("out.csv")
file.text = (["Company"]+labels.keySet()).join(";") + "\n"
rows.eachWithIndex { row , idx->
    List<String> details = []
    labels.entrySet().eachWithIndex { entry, i ->
        details << (row[entry.value] ?: 0.0).toString()
    }
    file << "${idx+1};"+details.join(';')+"\n"
}
By the moment nothing special, only a CSV file with a header using ";" as separator
Spark
Next we’ll create a "local" spark session and read the csv
def spark = SparkSession
        .builder()
        .appName("CustomersKMeans")
        .config(new SparkConf().setMaster("local"))
        .getOrCreate()

def dataset = spark.read()
        .option("delimiter", ";")
        .option("header", "true")
        .option("inferSchema", "true")
        .csv("out.csv")
Transforming origin
We need to transform our dataset, adding some new columns and normalizing others:
def assembler = new VectorAssembler(inputCols: labels.keySet(), outputCol: "features")

dataset = assembler.transform(dataset)

def scaler = new StandardScaler(inputCol: "features", outputCol: "scaledFeatures", withStd: true, withMean: true)

def scalerModel = scaler.fit(dataset)

dataset = scalerModel.transform(dataset)
We add a new "features" column and write on it all the labels (defined at the beginning), so features will contain "Users, Documents, API,… "
Also, we’ll transform the data using a StandardScalar so all data will be standarized using their media
Running a kMean
def kmeans = new KMeans(k:5 ,seed:1, predictionCol: "Cluster", featuresCol: "scaledFeatures" )

def kmeansModel = kmeans.fit(dataset)

// Make predictions
def predictions = kmeansModel.transform(dataset)
We want to have 5 groups (this is a "business" requirements. They are ways to find the optimal number). We want to "create" a new column called "Cluster" where indicate in which group the data is (by default the column is called "prediction,") and also we indicate which columns used, "scaledFeatures" in this case, created previously
Showing the cluster
We’ll create a copy of the original dataset, and we’ll join to it a new columnCluster from predictions
def copy = dataset.alias("copy")
copy = copy.join(predictions.select("Company", "Cluster"), "Company", "inner")
copy.show(3)

+-------+-----+---------+--------+----+---+---+--------+--------------------+--------------------+-------+
|Company|Users|Documents|Finished|Days|API|Web|Workflow| features| scaledFeatures|Cluster|
+-------+-----+---------+--------+----+---+---+--------+--------------------+--------------------+-------+
| 1|238.0| 26906.0| 20987.0| 4.0|0.0|1.0| 0.0|[238.0,26906.0,20...|[5.09496005230008...| 0|
| 2| 1.0| 16.0| 9.0| 0.0|0.0|0.0| 0.0|(7,[0,1,2],[1.0,1...|[-0.3286794172192...| 0|
| 3| 80.0| 0.0| 0.0| 0.0|0.0|0.0| 0.0| (7,[0],[80.0])|[1.47920040595383...| 0|
+-------+-----+---------+--------+----+---+---+--------+--------------------+--------------------+-------+
only showing top 3 rows
as you can see right now we have a copy dataset with original data plus a Cluster column indicating in which cluster this customer is
From here you can use this information to iterate over the dataset and generate some diagrama, update a database, … or create some HTML charts
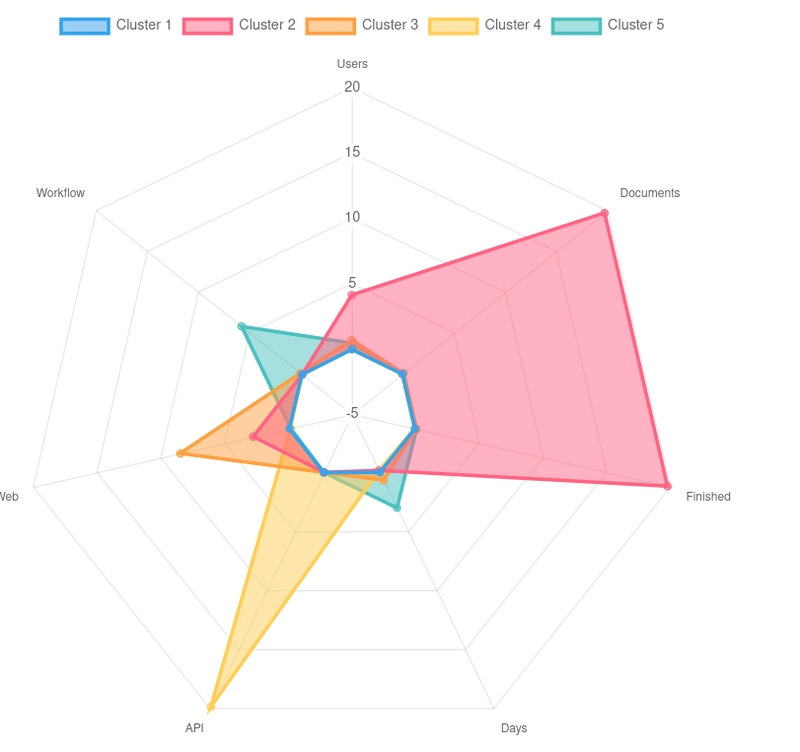
Chart.js
In this post we want to create an HTML visualization using chart.js so we’ll create a data.js containing a Javascript object to embed in an index.html
def json = [
    labels:labels.keySet(),
    datasets:[]
]
kmeansModel.clusterCenters().eachWithIndex{v,i->
    json.datasets << [
            label:"Cluster ${i+1}",
            data: v.toArray(),
            fill: true
    ]
}
new File("data.js").text = "const dataArr = "+JsonOutput.prettyPrint(JsonOutput.toJson(json))
Most important part here is kmeansModel.clusterCenters()
We create a JSON where datasets is an array of objects (required by chart.js) containing an array of doubles with their centers
Lastly we have an index.html with chart.js and data.js included
<head>
    <meta charset="UTF-8">
    <title>Clustering Customers</title>
    <script src="https://momentjs.com/downloads/moment.js"></script>
    <script src="https://cdn.jsdelivr.net/npm/chart.js"></script>
    <script src="./data.js"></script>
</head>
...
    <div style="width:75%; height: 40rem">
        <canvas id="canvas"></canvas>
    </div>
...
<script>
    const config = {
        type: 'radar',
        data: dataArr,
        options: {
            elements: {
                line: {
                    borderWidth: 3
                }
            }
        },
    };

    window.onload = function() {
        var ctx = document.getElementById('canvas').getContext('2d');
        window.myLine = new Chart(ctx, config);
    };
</script>
....
Nothing special but visually very attractive:
Source
Here you can find the source code
https://gist.github.com/jagedn/184302ac4f89def14410f8a6f54a93ea

Top comments (0)