

What are the key metrics to track in mobile marketing analytics? The essential metrics in mobile marketing analytics include Click-Through Rate (CTR), Cost Per Install (CPI), Customer Acquisition Cost (CAC), Return on Ad Spend (ROAS), and Lifetime Value (LTV), which together evaluate top-of-funnel acquisition efficiency, post-install monetization, and long-term campaign profitability.
Mobile marketing analytics is the systematic aggregation, attribution, and analysis of multi-channel advertising performance, in-app user engagement, and post-install monetization data. By connecting top-of-funnel acquisition expenditures with long-term cohort revenue, marketing analytics enables growth teams to measure campaign Return on Ad Spend (ROAS), calculate Customer Acquisition Cost (CAC), and optimize budget allocation across paid and organic channels.
| Term | Definition |
|---|---|
| Marketing Analytics | The framework connecting media spend, user journeys, and monetization metrics. |
| ROAS | Return on Ad Spend: the ratio of revenue generated to advertising cost incurred. |
| Customer Acquisition Cost | Total acquisition expenditure divided by newly acquired paying customers under a defined conversion criterion. |
| Lifetime Value | A cumulative revenue or margin measure calculated over a defined user or customer population and time horizon. |
The Unit Economics Framework of Mobile Marketing Analytics
The Core Financial Relationship: Evaluating CAC Against Cohort LTV
Sustainable mobile app growth is governed by the structural relationship between Customer Acquisition Cost (CAC) and Lifetime Value (LTV). While top-of-funnel advertising campaigns focus on acquiring users at low upfront costs, long-term business viability requires that the cumulative net revenue generated by an acquired cohort exceeds the total capital spent to acquire it.
To maintain mathematical validity, growth teams must evaluate LTV and acquisition cost on identical population denominators:
- Paying-Customer Model (Unit Economics & Margin Analysis): Evaluates acquisition spend strictly against converted paying customers: CACPaid=Newly Acquired Paying CustomersDirect Paid Ad Spend Customer LTV(N)=Newly Acquired Paying CustomersCumulative Net Revenue from Paying Customers Through Day N Unit Economics Ratio=CACPaidCustomer LTV(N)
- Acquired-User Cohort Model (Cohort Recovery & Payback): Evaluates acquisition spend across all acquired app users on Day 0: Acquisition Cost per User=Total Acquired Userscohort,0Direct Paid Ad Spend Revenue LTV(N)=Total Acquired Userscohort,0∑d=0NNet Cohort Revenued
There is no universal LTV-to-CAC threshold that applies across all mobile businesses. Some growth teams use ratios such as 3:1 as an internal planning heuristic, but the appropriate target depends on gross margin, payback horizon, customer churn, capital availability, and the specific accounting definition of LTV used in the financial model. When LTV and acquisition cost are defined on the same denominator, a ratio below 1 indicates that the measured cohort has not recovered its acquisition cost within the modeled horizon. Organic acquisition can improve blended company-level economics, but it should be analyzed as an independent performance layer.

The Danger of Vanity Metrics: Why Raw Install Volumes Mask Negative Unit Economics
Evaluating performance marketing performance solely through install volume or Cost Per Install (CPI) introduces significant distortions into budget allocation. An ad network delivering $0.50 CPIs may appear superior to a channel delivering $3.00 CPIs on high-level executive dashboards.
However, if the $0.50 install cohort exhibits high Day-1 drop-off and generates negligible downstream revenue, its effective acquisition cost per paying customer far exceeds its revenue yield. Conversely, a $3.00 install cohort that achieves steady Day-30 retention and consistent monetization delivers viable unit economics. Marketing analytics must evaluate downstream conversion efficiency rather than stopping at the installation event.

The Multi-Tier Attribution Pipeline: Connecting Impressions to Downstream Purchase Events
To compute accurate unit economics, mobile measurement architectures establish an unbroken data pipeline spanning four operational phases:
- Media Delivery: Capturing impressions, ad spend, and placement tokens at the ad network edge.
- Conversion Ingestion: Logging app installations via store-mediated referral APIs, platform attribution frameworks, or first-party routing layers.
- In-App Event Tracking: Capturing post-install milestone events (such as account registration, tutorial completion, and level progression).
- Monetization Reconciliation: Ingesting in-app purchases (IAP), subscription renewals, and ad revenue into a centralized data warehouse to generate unified cohort reporting. 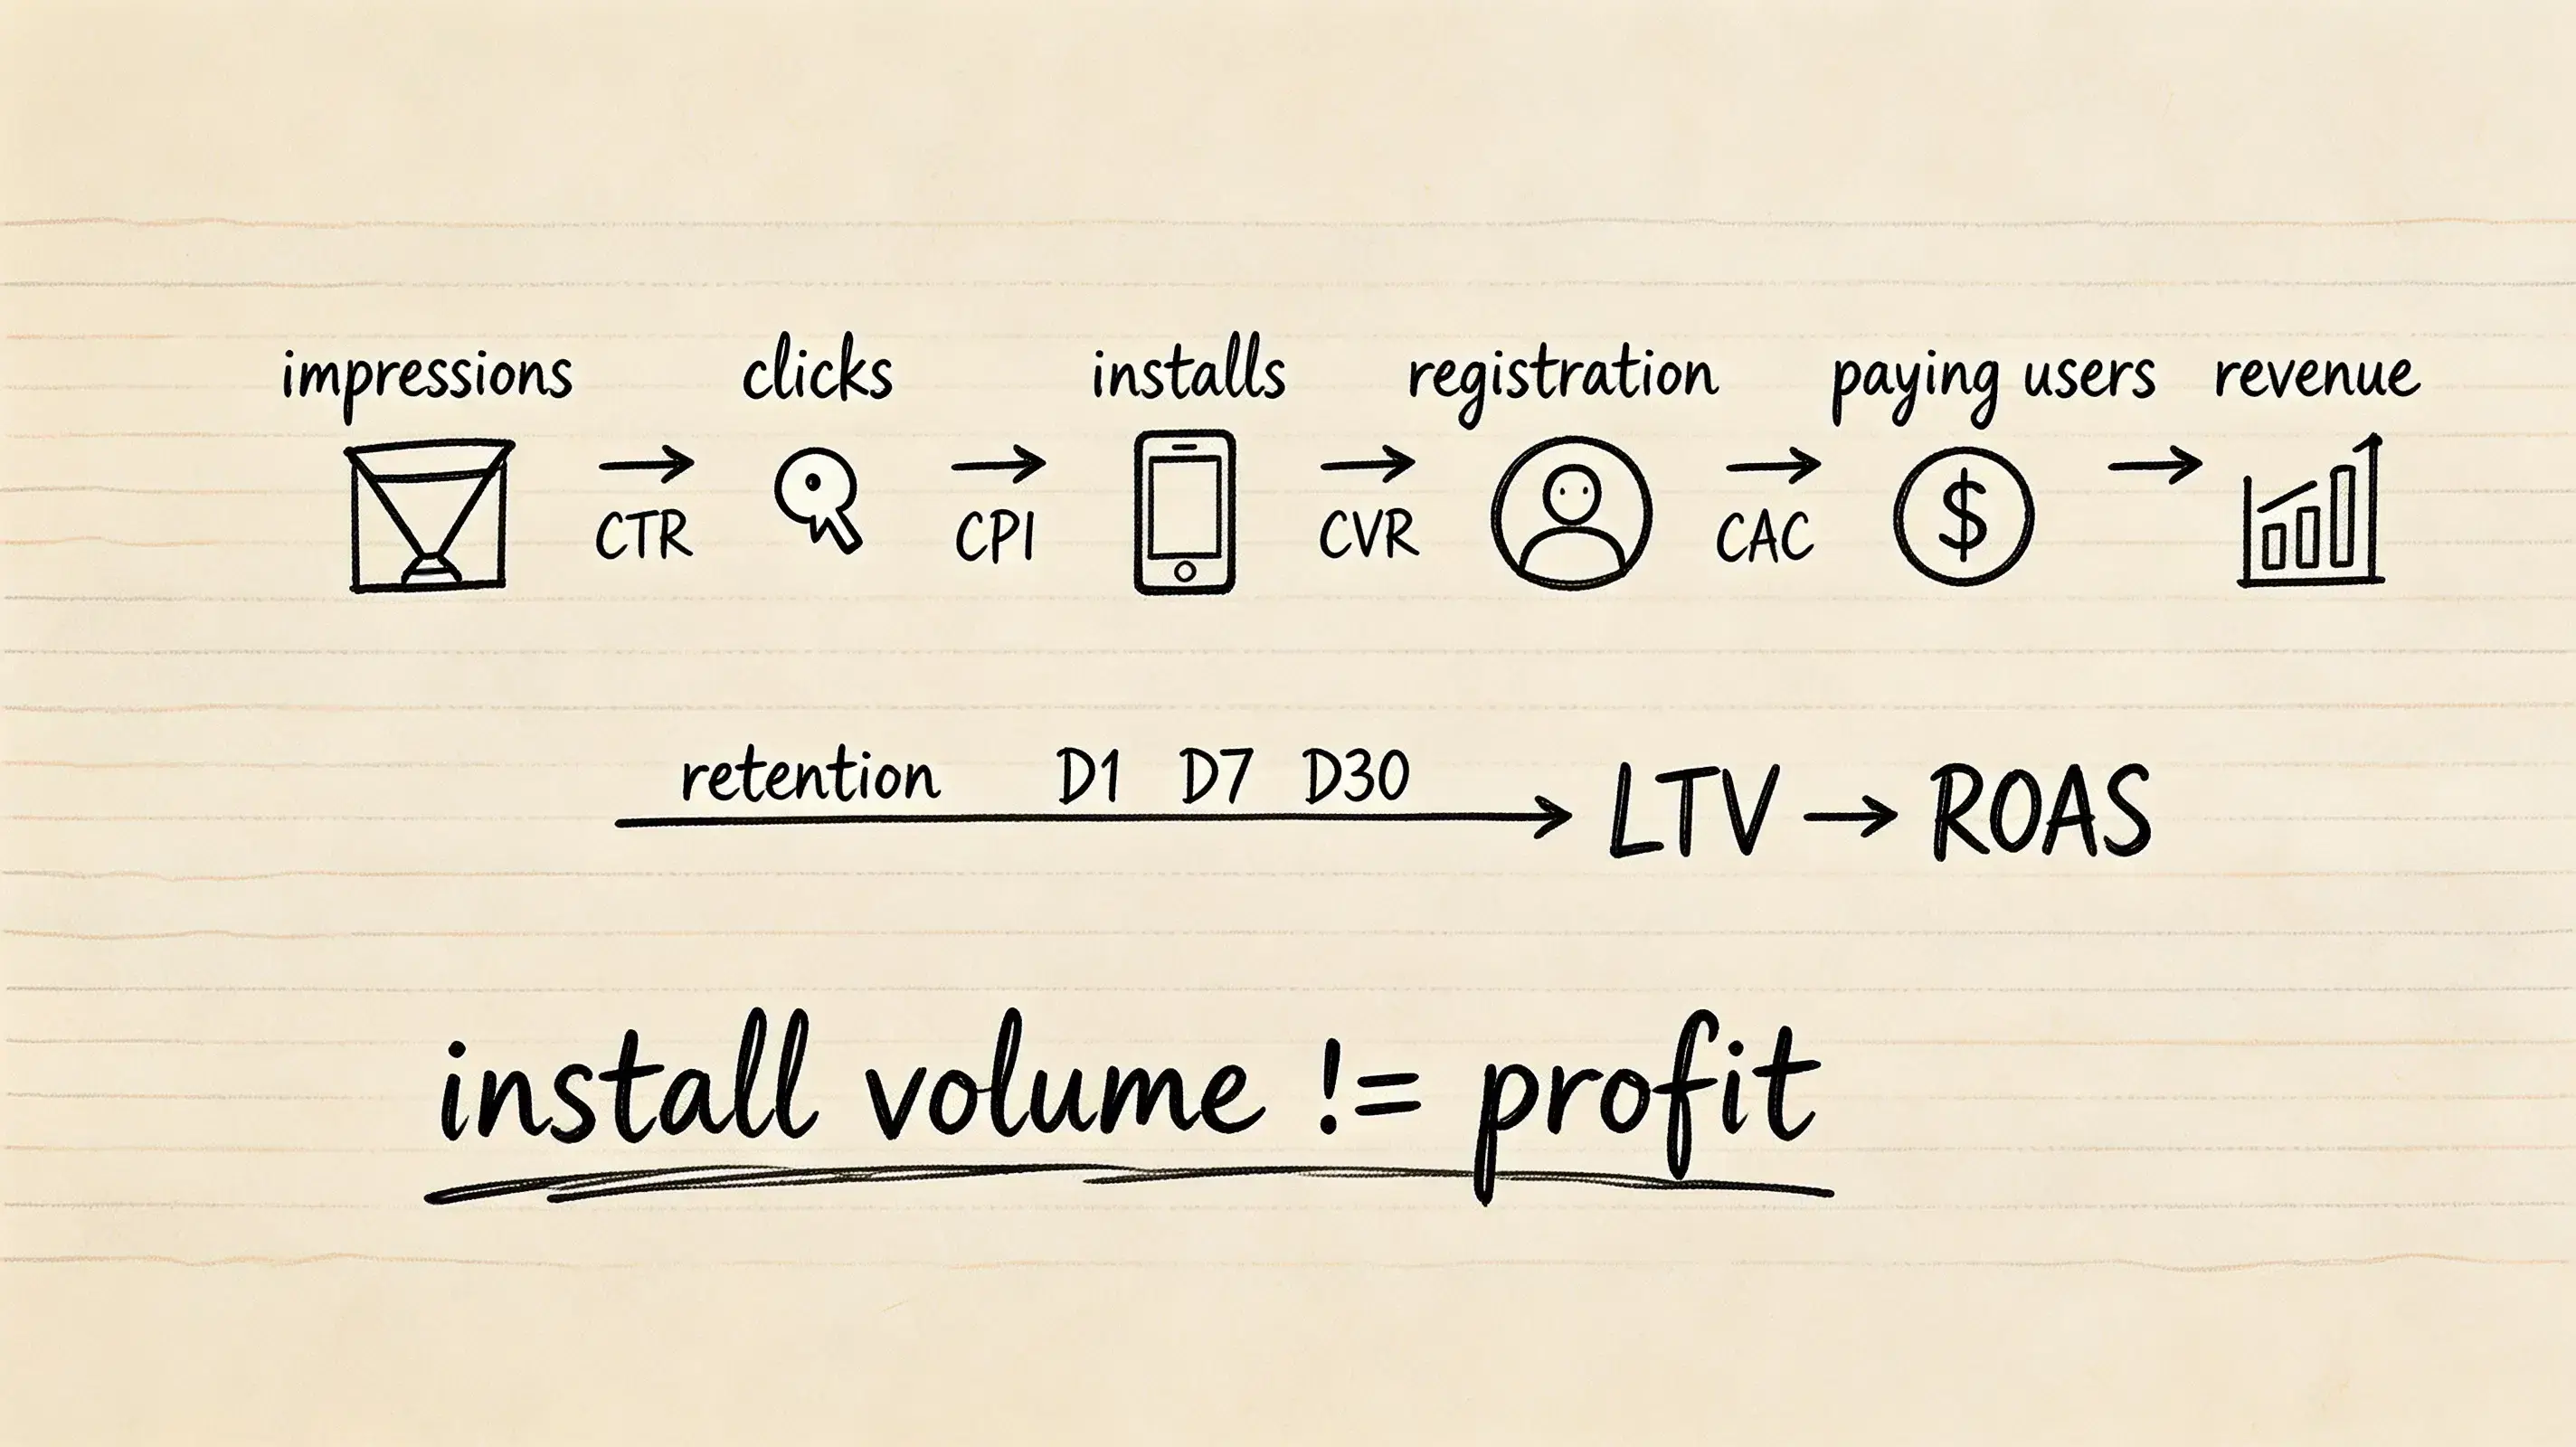
See Also: Marketing Analytics ──> Mobile Attribution Architecture
Core Top-of-Funnel Acquisition Metrics: CPM, CTR, CPC, and CPI
Cost Per Mille (CPM) and Cost Per Click (CPC): Measuring Media Cost and Placement Dynamics
Top-of-funnel media metrics diagnose the cost efficiency and competitive dynamics of your ad placements:
- Cost Per Mille (CPM): The media cost to deliver 1,000 ad impressions: CPM=Total ImpressionsTotal Ad Spend×1000 Rising CPMs can reflect increased bidding competition within your target audience segment, seasonal market pressure, format shifts, or creative fatigue.
- Cost Per Click (CPC): The average cost incurred for each verified click on an ad creative: CPC=Total ClicksTotal Ad Spend
Click-Through Rate (CTR): Diagnosing Creative Resonance and Ad Fatigue
Click-Through Rate measures the proportion of delivered impressions that result in an intentional user click:
CTR=Total ImpressionsTotal Clicks×100%A declining CTR across an active campaign can indicate audience saturation, creative exhaustion, or shifting placement mix, signaling that creative assets should be refreshed to maintain downstream conversion velocity.
Cost Per Install (CPI): Evaluating Top-of-Funnel Conversion Friction
Cost Per Install measures the average media expenditure required to generate a single application installation:
CPI=Total Attributed InstallsTotal Ad SpendCPI reflects the combined efficiency of ad creative resonance, app store product page optimization (ASO), and app package download conversion rates.
Top of Funnel: Media Exposure & Clicks
[Impressions] ──► [Clicks] (CTR) ──► [Installs] (CPI)
                       │
                       ▼
Mid-Funnel: Activation & Onboarding
[Registrations] ──► [Core Milestones] ──► [Paying Customers] (CAC)
                       │
                       ▼
Bottom-Funnel: Monetization & Retention
[Purchases / Ads] ──► [D1/D7/D30 Retention] ──► [Cohort LTV] ──► [Cohort ROAS %]
Mid-Funnel Activation and Engagement: Conversion Rate, CAC, and Retention
Install-to-Registration Conversion Rate (CVR): Detecting Onboarding Drop-Offs
Acquiring an install does not create enterprise value until the user successfully activates. The Install-to-Registration conversion rate evaluates onboarding friction:
CVRInstall→Reg=Total App InstallsTotal Registered Users×100%A sharp drop-off between installation and registration typically diagnoses broken deep links, mandatory account registration friction, or misaligned user expectations established by top-of-funnel ad creatives.
Paid CAC vs Blended CAC: Measuring Organic Lift and Referral Multipliers
Analytics teams must distinguish between Paid Customer Acquisition Cost and Blended Customer Acquisition Cost:
- Paid CAC: Evaluates acquisition cost strictly across directly attributed paid marketing expenditures: CACPaid=Directly Attributed Paying CustomersDirect Paid Ad Spend
- Blended Acquisition Cost: Evaluates overall organizational acquisition efficiency by dividing total marketing expenditure by the sum of all acquired customers across paid, organic, and viral referral channels: CACBlended=Total New Paying Customers (Paid + Organic + Viral)Total Marketing Expenditures
Strong organic or referral acquisition can reduce blended acquisition cost relative to paid-only CAC when incremental non-paid customer volume grows faster than the additional marketing expenditure included in the blended numerator.
Retention Metrics: Evaluating Product Stickiness and Churn Checkpoints
User retention measures the percentage of users from an acquired cohort who return to the application N days after their first launch:
Retention Rate(DN)=Total Users in Acquisition Cohort on Day 0Active Users on Day N×100%- Day-1 Retention (D1): Diagnoses first-time user experience (FTUE), initial app usability, and registration friction.
- Day-7 Retention (D7): Measures whether the application has successfully integrated into the user’s weekly habit loop.
- Day-30 Retention (D30): Measures long-term utility, core feature resonance, and baseline customer churn rates.
Session Frequency and Engagement Cadence (DAU/MAU)
The ratio of Daily Active Users (DAU) to Monthly Active Users (MAU) evaluates engagement frequency:
App Stickiness=MAUDAU×100%DAU/MAU ratios should be interpreted against the application’s natural usage cadence and appropriate category benchmarks; a daily social or gaming application requires a significantly higher ratio than a monthly banking, travel, or utility application.
Bottom-Funnel Monetization and Profitability: ARPU, LTV, and ROAS
Average Revenue Per User (ARPU) and Average Revenue Per Paying User (ARPPU)
Monetization metrics quantify how effectively an active user base translates into gross revenue:
- Average Revenue Per User (ARPU): Measures the revenue generated across the active user base over a specific timeframe: ARPU=Total Active UsersTotal Revenue (IAP + Subscriptions + Ads)
- Average Revenue Per Paying User (ARPPU): Measures the revenue concentration strictly among users who completed a monetary transaction: ARPPU=Total Unique Paying UsersTotal Transaction Revenue
Formulating Cohort Lifetime Value
To ensure mathematical consistency across cohort analytics, Lifetime Value is calculated based on cumulative cohort revenue per acquired user:
- Cumulative Cohort Revenue LTV: The net revenue generated by an acquisition cohort through Day N, divided by the total number of users acquired on Day 0: LTV(N)=Acquired Userscohort,0∑d=0NNet Revenuecohort,d
- Predictive Retention LTV: Formulated by integrating the retention curve R(t) with the monetization rate per retained user M(t) over time: LTVpred=∫0∞R(t)⋅M(t)dt
Where R(t) represents the proportion of the cohort retained at time t, and M(t) represents the average revenue per retained user at time t.
Calculating Return on Ad Spend: Gross ROAS versus Net Revenue ROAS
Return on Ad Spend evaluates campaign revenue relative to advertising expenditures over specific temporal horizons:
- Gross ROAS: Evaluates gross in-app revenue generated directly before platform fee deductions: Gross ROAS(DN)=Initial Ad Spend on Day 0Cumulative Gross Revenue Through Day N×100%
- Net Revenue ROAS: Evaluates net revenue realized by the business after deducting app store commissions and transaction processing fees: Net Revenue ROAS(DN)=Initial Ad Spend on Day 0Cumulative Net Revenue Through Day N×100%
The JSON payload below illustrates a structured analytics event capturing immutable transaction metadata for downstream warehouse aggregation:
{
  "event_type": "marketing_conversion_telemetry",
  "event_id": "evt_20260826_99812344",
  "timestamp_utc": "2026-08-26T03:15:00Z",
  "user_context": {
    "anonymous_user_id": "usr_anon_88192a7b",
    "cohort_acquisition_date": "2026-08-19",
    "days_since_install": 7
  },
  "attribution_source": {
    "channel_id": "google_search_paid",
    "campaign_id": "cmp_us_brand_intent_v2",
    "ad_group_id": "grp_keyword_exact",
    "creative_id": "crt_text_ad_04",
    "attribution_model_applied": "first_touch_lookback_7d"
  },
  "financial_payload": {
    "event_name": "subscription_renew_month_1",
    "transaction_currency": "USD",
    "gross_revenue_cents": 1499,
    "platform_fee_cents": 225,
    "net_revenue_cents": 1274
  }
}
Multi-Channel Data Reconciliation and Discrepancy Prevention
Deconstructing Cross-Channel Attribution Discrepancies
Growth teams operating across multiple ad networks frequently encounter data discrepancies between ad network dashboards, app store console reports, and internal BI warehouses.
Common technical root causes include:
- Timezone Misalignment: Ad networks reporting on Pacific Time (PST/PDT) while internal data warehouses ingest event streams in Coordinated Universal Time (UTC).
- Lookback Window Discrepancies: Ad networks claiming conversions over a 30-day window, while internal analytics platforms enforce strict 24-hour or 7-day attribution windows.
- Currency and Fee Differences: Ad networks reporting gross media spend before platform taxes, while app store reports reflect net developer revenue after platform transaction fees.
Self-Attributing Networks and Multi-Touch Overlap
Self-Attributing Networks (SANs) evaluate attribution using interaction data available inside their own closed ecosystems. Because each platform applies different attribution windows, view-through rules, and modeled conversion estimates, the sum of network-reported conversions across individual dashboards often exceeds a separately deduplicated measurement view.
Independent attribution platforms reconcile these discrepancies by applying consistent attribution logic across participating channels, providing a unified reporting layer while acknowledging platform-specific privacy constraints.
Reconciling Platform Postbacks with First-Party Event Streams
With privacy frameworks such as Apple AdAttributionKit and SKAdNetwork delivering privacy-preserving, delayed attribution postbacks without user-level identifiers, modern data engineering architectures deploy dual reconciliation pipelines:
- Macro Stream: Combines privacy-preserving attribution postbacks with ad-network spend data and compatible revenue mappings to estimate campaign-level acquisition performance and directional ROAS.
- Micro Stream: Captures first-party contextual parameters and in-app event telemetry to evaluate conversion funnels, onboarding retention, and product feature engagement.
Cohort Analysis: Tracking Payback Periods and Retention Curves
Constructing the Cohort Retention Grid
Cohort analysis organizes users into discrete groups based on their acquisition date and marketing channel, tracking their performance horizontally across calendar days.
The standard cohort analysis evaluation framework:
- Horizontal Axis (Temporal Decay): Tracks how a single cohort’s retention, engagement, and cumulative revenue evolve as time elapses from Day 0 through Day 30+.
- Vertical Axis (Cohort Quality Shift): Compares performance across different calendar cohorts at the same relative lifecycle day, evaluating whether product updates or creative iterations improved cohort quality.
Calculating the Cohort Net Revenue Payback Period
The Cohort Net Revenue Payback Period represents the exact number of days required for an acquisition cohort’s cumulative net revenue to equal or exceed the total advertising expenditure spent to acquire that cohort:
Payback Day=min{tCumulative Net Cohort Revenue Through Day t≥Cohort Acquisition Spend}A shorter payback period reduces working capital requirements, enabling growth teams to reinvest revenue more rapidly into scaling acquisition campaigns.
The Python script below demonstrates how to compute continuous cohort retention grids, cumulative gross and net LTV curves, and net revenue payback horizons from raw event logs:

import numpy as np
import pandas as pd

def calculate_cohort_unit_economics(
    events_df: pd.DataFrame,
    ad_spend_df: pd.DataFrame,
    max_lifecycle_days: int = 90
) -> pd.DataFrame:
    """
    Computes cohort retention checkpoints, cumulative gross and net LTV curves,
    gross and net revenue ROAS percentages, and net revenue payback days.

    events_df columns: ['user_id', 'acquisition_cohort', 'event_date', 'gross_revenue_cents', 'net_revenue_cents']
    ad_spend_df columns: ['acquisition_cohort', 'total_spend_cents', 'acquired_users', 'paying_customers']

    Note: Any user with at least one recorded event on lifecycle day N is considered active for this example retention calculation.
    """
    # Input Validation
    if ad_spend_df['acquired_users'].min() <= 0:
        raise ValueError("Acquired users count must be greater than zero for all cohorts.")
    if ad_spend_df['total_spend_cents'].min() < 0:
        raise ValueError("Total ad spend cannot be negative.")

    # 1. Compute lifecycle day for each event
    events_df['event_date'] = pd.to_datetime(events_df['event_date'])
    events_df['acquisition_cohort'] = pd.to_datetime(events_df['acquisition_cohort'])
    events_df['lifecycle_day'] = (events_df['event_date'] - events_df['acquisition_cohort']).dt.days

    valid_events = events_df[(events_df['lifecycle_day'] >= 0) & (events_df['lifecycle_day'] <= max_lifecycle_days)].copy()

    # 2. Build Continuous Daily Revenue Matrices (Gross and Net)
    all_days = list(range(0, max_lifecycle_days + 1))

    # Net Revenue Matrix
    cohort_net_sparse = valid_events.groupby(['acquisition_cohort', 'lifecycle_day'])['net_revenue_cents'].sum().unstack(fill_value=0)
    cohort_net_daily = cohort_net_sparse.reindex(columns=all_days, fill_value=0)
    cumulative_net_revenue = cohort_net_daily.cumsum(axis=1)

    # Gross Revenue Matrix
    cohort_gross_sparse = valid_events.groupby(['acquisition_cohort', 'lifecycle_day'])['gross_revenue_cents'].sum().unstack(fill_value=0)
    cohort_gross_daily = cohort_gross_sparse.reindex(columns=all_days, fill_value=0)
    cumulative_gross_revenue = cohort_gross_daily.cumsum(axis=1)

    # 3. Calculate Cohort Retention Matrix (Active unique users per day / initial cohort users)
    ad_spend_df['acquisition_cohort'] = pd.to_datetime(ad_spend_df['acquisition_cohort'])
    spend_indexed = ad_spend_df.set_index('acquisition_cohort')

    cohort_active_users = valid_events.groupby(['acquisition_cohort', 'lifecycle_day'])['user_id'].nunique().unstack(fill_value=0)
    cohort_active_users = cohort_active_users.reindex(columns=all_days, fill_value=0)

    unit_economics = pd.DataFrame(index=cumulative_net_revenue.index)
    unit_economics['acquired_users'] = spend_indexed['acquired_users']
    unit_economics['paying_customers'] = spend_indexed['paying_customers']
    unit_economics['ad_spend_cents'] = spend_indexed['total_spend_cents']

    # Cost Metrics: Cost per Acquired User vs Paid CAC per Paying Customer
    unit_economics['cost_per_acquired_user_usd'] = (unit_economics['ad_spend_cents'] / unit_economics['acquired_users']) / 100.0

    # Handle zero paying customers gracefully to prevent division by zero
    unit_economics['paid_cac_per_paying_customer_usd'] = np.where(
        unit_economics['paying_customers'] > 0,
        (unit_economics['ad_spend_cents'] / unit_economics['paying_customers']) / 100.0,
        np.nan
    )

    # 4. Extract Cumulative LTV ($) and Retention (%) checkpoints
    for day in [1, 7, 30, 60, 90]:
        if day <= max_lifecycle_days:
            # Retention rate at Day N
            active_at_day = cohort_active_users[day] if day in cohort_active_users.columns else 0
            unit_economics[f'retention_d{day}_pct'] = (active_at_day / unit_economics['acquired_users']) * 100.0

            # Cumulative Gross LTV ($ per acquired user) through Day N
            gross_rev_through_day = cumulative_gross_revenue[day]
            unit_economics[f'gross_ltv_d{day}_usd'] = (gross_rev_through_day / unit_economics['acquired_users']) / 100.0

            # Cumulative Net Revenue LTV ($ per acquired user) through Day N
            net_rev_through_day = cumulative_net_revenue[day]
            unit_economics[f'net_ltv_d{day}_usd'] = (net_rev_through_day / unit_economics['acquired_users']) / 100.0

            # Cumulative Gross ROAS (%) through Day N
            gross_rev_through_day = cumulative_gross_revenue[day]
            unit_economics[f'gross_roas_d{day}_pct'] = (gross_rev_through_day / unit_economics['ad_spend_cents']) * 100.0

            # Cumulative Net Revenue ROAS (%) through Day N
            unit_economics[f'net_roas_d{day}_pct'] = (net_rev_through_day / unit_economics['ad_spend_cents']) * 100.0

    # 5. Calculate Cohort Net Revenue Payback Day (First lifecycle day where Cumulative Net Revenue >= Total Ad Spend)
    def find_payback_day(cohort_date):
        spend = spend_indexed.loc[cohort_date, 'total_spend_cents']
        cum_net_series = cumulative_net_revenue.loc[cohort_date]
        break_even_days = cum_net_series[cum_net_series >= spend].index
        return int(break_even_days[0]) if len(break_even_days) > 0 else np.nan

    unit_economics['net_revenue_payback_day'] = [find_payback_day(c) for c in unit_economics.index]

    return unit_economics.reset_index()

# Example Execution:
if __name__ == "__main__":
    sample_events = pd.DataFrame({
        'user_id': ['u1', 'u2', 'u1', 'u3', 'u2'],
        'acquisition_cohort': ['2026-08-01', '2026-08-01', '2026-08-01', '2026-08-01', '2026-08-01'],
        'event_date': ['2026-08-01', '2026-08-02', '2026-08-08', '2026-08-15', '2026-08-30'],
        'gross_revenue_cents': [1199, 1799, 599, 3499, 2399],
        'net_revenue_cents': [999, 1499, 499, 2999, 1999]
    })
    sample_spend = pd.DataFrame({
        'acquisition_cohort': ['2026-08-01'],
        'total_spend_cents': [5000],
        'acquired_users': [3],
        'paying_customers': [2]
    })

    results = calculate_cohort_unit_economics(sample_events, sample_spend, max_lifecycle_days=30)
    print("--- Cohort Unit Economics Summary ---")
    print(results.to_string(index=False))
Metric Priorities across Mobile Business Models
Both Apple App Store Connect Analytics and Google Play Console provide contextual peer-group benchmarks that allow developers to compare performance against relevant app categories. Metric priorities vary fundamentally based on product monetization structure:
| Business Model | Primary Retention Focus | Core Unit Economics Metric | Target Payback Focus | Primary ROAS Optimization Metric |
|---|---|---|---|---|
| Mobile Gaming (IAP + Ads) | D1, D7, and D30 Retention | Cumulative ARPU & Paying Conversion | Early- to mid-lifecycle recovery aligned with monetization curves | D7 / D30 Blended ROAS |
| E-Commerce & Retail | 30-Day Repurchase Rate | Net Contribution Margin per Order | Purchase-cycle and contribution-margin recovery | First-Purchase & D30 Repeat ROAS |
| Subscription & B2B SaaS | Monthly / Annual Churn Rate | Subscriber LTV to Paid CAC Ratio | Recovery across recurring subscription renewal cycles | Month-3 & Month-12 Cumulative ROAS |
| Fintech & Banking | 30-Day Funded Account Rate | Contribution Margin per Active Account | Longer-horizon, risk-adjusted customer economics | Long-Tail Account Deposit LTV |
Frequently Asked Questions (FAQ)
What is the difference between ROI and ROAS in mobile app marketing?
Return on Ad Spend (ROAS) measures gross revenue generated directly by a specific advertising campaign divided by its advertising cost (ROAS=Ad SpendRevenue×100%). Return on Investment (ROI) evaluates net profit by accounting for all business operating costs, including cost of goods sold, payment processing fees, and overhead (ROI=Total CostNet Profit×100%).
Why do ad network dashboard metrics differ from internal BI reports?
Discrepancies arise due to differences in attribution logic, lookback window lengths, timezone reporting alignments, view-through policies, modeled conversions, and privacy frameworks. An independent attribution layer provides a consistent reconciliation view where comparable signals are available, but platform-specific methodological differences may remain.
How does cohort analysis improve mobile ad spend allocation?
Cohort analysis groups users based on the specific acquisition date and channel, tracking their cumulative behavior and revenue over time. By observing which historical cohorts achieve faster CAC payback and higher Day-30 retention, growth teams allocate budget toward high-LTV channels while defunding channels with rapid early churn.
Summary and Decision Framework
Optimizing mobile app ROAS requires moving beyond top-of-funnel install metrics to establish a full-funnel measurement architecture. By connecting media acquisition costs (CPM, CPC, CPI) to downstream activation, retention, and cohort monetization metrics (CAC, LTV, ROAS, Payback Period), growth teams gain the transparency needed to achieve sustainable unit economics.
Platforms like OpoInstall provide infrastructure to capture multi-channel attribution data, reconcile cross-network discrepancies, and stream raw conversion events to internal BI systems, delivering the foundation for data-driven marketing analytics.
To learn more about configuring multi-channel tracking and building advanced marketing analytics dashboards, review the OpoInstall documentation.
Related Materials
- Concepts: Mobile Marketing Analytics, Return on Ad Spend, Customer Acquisition Cost, Cohort Analysis, Payback Period
- Technologies: Attribution Data Warehouses, Real-Time Ingestion Pipelines, StoreKit Measurement, OpoInstall Mobile SDK
- Standards: IETF RFC 8259 JSON Specification, W3C Performance Metrics Guidance
- APIs: OpoInstall Event Ingestion API, App Store Connect Analytics Reports API


Top comments (0)