
Chart.js is a powerful and easiest way to create charts in vuejs, we use HTML5 element for print the graphs. With Vue’s data() object, it is possible to store data and manipulate it to change graphs when needed.
We will do this task in 3 steps.
Step 1 - Setting up the project:
create new project-
vue create chart_example --default
navigate to project directory-
cd chart_example
install Chart.js in our project-
npm install chart.js
Step 2 - creating component for chart
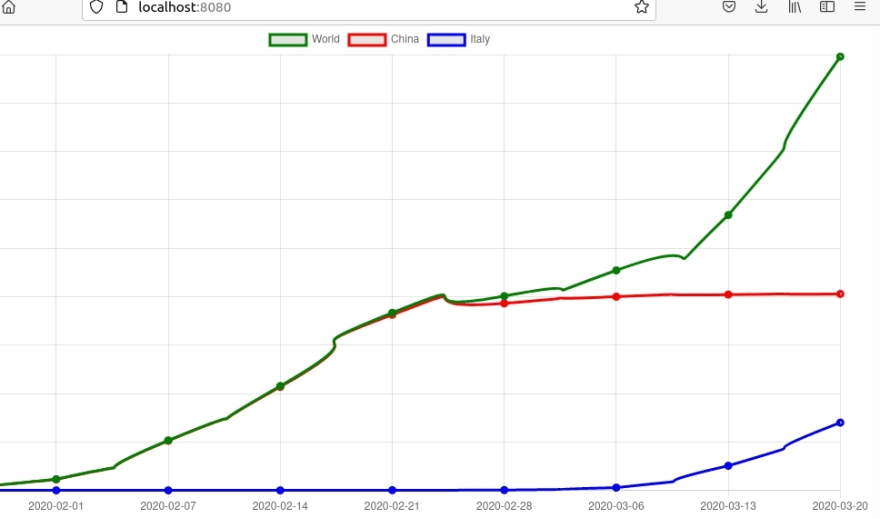
We are going to print line chart for dataset of corona cases.
create CoronaCases.vue file and insert below code:
src/components/CoronaCases.vue
<template>
    <div>
        <canvas id="corona-chart"></canvas>
    </div>
</template>

<script>
import Chart from 'chart.js/auto'
import coronaData from '../coronaData.js'

export default {
    name: 'CoronaCases',
    data(){
        return {
            coronaData: coronaData
        }
    },
    mounted() {
        const ctx = document.getElementById('corona-chart');
        new Chart(ctx, this.coronaData);
}
}
</script>
here coronaData.js file contains our data(it defines in next step).
Creating a chart with Chart.js resembles the following:
const ctx = document.getElementById('example');

const exampleChart = new Chart(ctx, {

  type: '',

  data: [],

  options: {},

});
A <canvas> element is passed in along with a type, data, and options.
Step 3 - Creating the Chart data
We will define our data separate from main CoronaCases.vue file. create coronaData.js in src folder;
src/coronaData.js
export const coronaData = {
    type: "line",
    data: {
        labels: ["2020-01-24","2020-02-01","2020-02-07","2020-02-14","2020-02-21","2020-02-28","2020-03-06","2020-03-13","2020-03-20"],
        datasets: [
            {
                label: "World",
                data: [282, 4593,  20630,  43103,  73332, 80239,  90869, 113702, 179112],
                borderColor: "green",
                borderWidth:3
            },
            {
                label: "China",
                data: [278, 4537,  20471,  42708,  72528, 77262,  79968, 80859, 81116],
                borderColor: "red",
                borderWidth:3
            },
            {
                label: "Italy",
                data: [0, 0,  2,  3,  76, 124,  1128, 10149, 27980],
                borderColor: "Blue",
                borderWidth:3
            },
        ]
    },
    options: {
        responsive: true,
        lineTension: 1,
        scales: {
          yAxes: [
            {
              ticks: {
                beginAtZero: true,
                padding: 25
              }
            }
          ]
        }
      }
};

export default coronaData;
Next, you will modify the App.vue file to use the new CoronaCases.vue:
src/App.vue
<template>
  <div id="app" class="App">
    <CoronaCases/>
  </div>
</template>

<script>
import CoronaCases from '@/components/CoronaCases';

export default {
  name: 'App',
  components: {
    CoronaCases
  }
}
</script>

<style>
</style>
Now go to the terminal and fire the below command:
npm run serve
output

Oldest comments (0)