As we are operating a lot of servers we need a proper monitoring solution.AWS offers CloudWatch which is an almost perfect solution for monitoring your AWS cloud infrastructure.
But we also operate servers on other cloud providers (Softlayer, Azure,…) and we need one monitoring solution to track all of these servers.
As you might know, I’m a huge fan of Prometheus, the only graduated Monitoring project of CNCF.
If you want to know more what Prometheus is and how you can use it I recommend you to watch this YouTube Movie "Monitoring, the Prometheus Way" where Julius Volz, Co-Founder Prometheus, gives a very good introduction into the topic.
I also gave a talk on Prometheus and how to use it with IBM Connections last year at the DNUG event in Darmstadt. It’s only available in German but have a look at the presentation if you are interested in how you can monitor IBM Connections with Prometheus:
So how can we use Prometheus together with our AWS Cloud Infrastructure?
We will need following parts:
Agents on the EC2 instances (called node_exporter)
Prometheus with configured AWS Service Discovery (in this case only for EC2 instances)
node_exporter on EC2 instances
Installing the node_exporter on EC2 instances is straight forward, just use following User data script:
useradd -m -s /bin/bash prometheus
# (or adduser --disabled-password --gecos "" prometheus)

# Download node_exporter release from original repo
curl -L -O https://github.com/prometheus/node_exporter/releases/download/v0.17.0/node_exporter-0.17.0.linux-amd64.tar.gz

tar -xzvf node_exporter-0.17.0.linux-amd64.tar.gz
mv node_exporter-0.17.0.linux-amd64 /home/prometheus/node_exporter
rm node_exporter-0.17.0.linux-amd64.tar.gz
chown -R prometheus:prometheus /home/prometheus/node_exporter

# Add node_exporter as systemd service
tee -a /etc/systemd/system/node_exporter.service << END
[Unit]
Description=Node Exporter
Wants=network-online.target
After=network-online.target
[Service]
User=prometheus
ExecStart=/home/prometheus/node_exporter/node_exporter
[Install]
WantedBy=default.target
END

systemctl daemon-reload
systemctl start node_exporter
systemctl enable node_exporter
The Prometheus server will scrape the node_exporter on the standard port 9100
→ don’t forget to add this port to your instance Security Group and grant access to the Prometheus Server
You may test if the node_exporter is running as expected by running following command locally on the EC2 instance:curl http://127.0.0.1:9100/metrics
If everything works you should get back the metrics of your server
# HELP go_gc_duration_seconds A summary of the GC invocation durations.
# TYPE go_gc_duration_seconds summary
go_gc_duration_seconds{quantile="0"} 2.8809e-05
go_gc_duration_seconds{quantile="0.25"} 3.7675e-05
go_gc_duration_seconds{quantile="0.5"} 4.8971e-05
go_gc_duration_seconds{quantile="0.75"} 6.1912e-05
go_gc_duration_seconds{quantile="1"} 0.000266006
go_gc_duration_seconds_sum 0.667055045
go_gc_duration_seconds_count 11450
# HELP go_goroutines Number of goroutines that currently exist.
# TYPE go_goroutines gauge
go_goroutines 9
...
The same will be scraped and recorded by the Prometheus server.
Prometheus AWS Service Discovery
The Prometheus server will talk to directly to the AWS API so you need to create a user with programmatic access and add following permission:
{
    "Version": "2012-10-17",
    "Statement": [
        {
            "Effect": "Allow",
            "Action": "ec2:DescribeInstances",
            "Resource": "*"
        }
    ]
}
→ The Prometheus server can get all metadata of the EC2 instances like IP addresses or tags
On the Prometheus server a scrape target has to be added to the prometheus.yml file with the access and secret key of the added user.You can do some relabeling magic which lets you reuse your EC2 tags and metadata in Prometheus which is very nice.
I.e. here we take the ec2_tag_name as instance value and we add two additional tags ( customer,role ) which we get from the ec2_tag_customer and ec2_tag_role
  - job_name: 'node'
    ec2_sd_configs:
      - region: YOURREGION
        access_key: YOURACCESSKEY
        secret_key: YOURSECRETKEY
        port: 9100
        refresh_interval: 1m
    relabel_configs:
      - source_labels:
        - '__meta_ec2_tag_Name'
        target_label: 'instance'
      - source_labels:
        - '__meta_ec2_tag_customer'
        target_label: 'customer'
      - source_labels:
        - '__meta_ec2_tag_role'
        target_label: 'role'
The Prometheus server will now get the private IP addresses of all of your EC2 instances
(by default the private IPs, but you can use the public ones as well, see ec2_sd_config documentation)
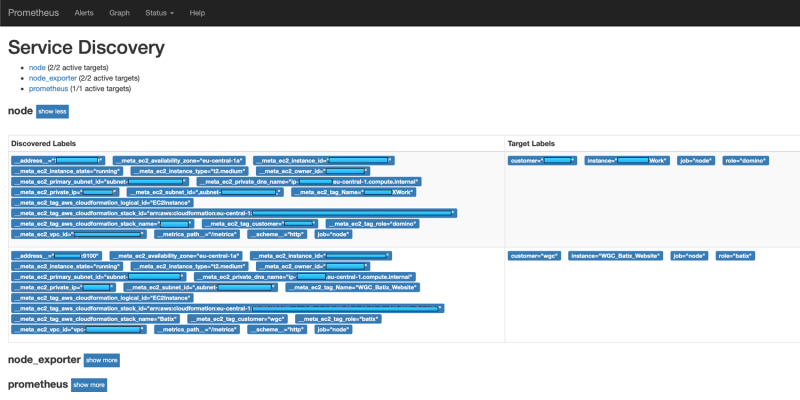
If you want to see which targets Prometheus gets through the Service Discovery browse to following URL of you Prometheus server:
-https://prometheus.server.com/service-discovery
Here you will see all your EC2 instances with their metadata and which data is reused in Prometheus:
Graphs and Dashboards
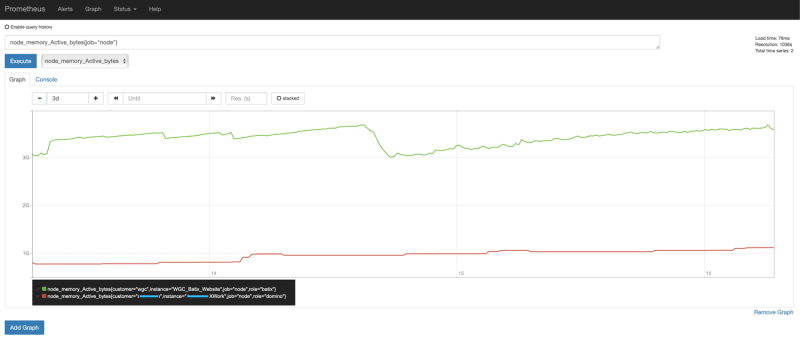
We defined that the metrics are scraped every minute and after some minutes we can see the results in the Prometheus UI:
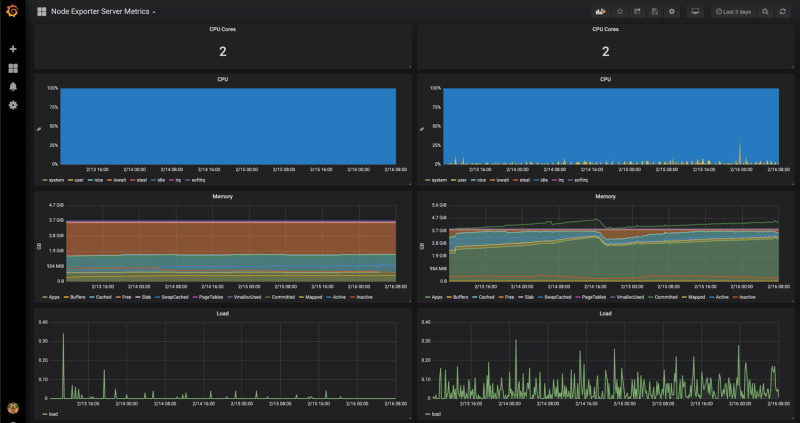
As you can see here we even get the data for the instance memory which we don’t have if we use CloudWatch for Monitoring.If you wan’t to have real dashboards for your monitoring just add Grafana which is natively supporting Prometheus as Data Source and you can create such nice dashboards:
Maybe you know now why I’m a big fan of Prometheus and as someone which is also using Prometheus to monitor his Kubernetes environment I can tell you we just scratched on the surface of what is possible with Prometheus.


Top comments (0)