In the previous post, I setup very basic alert by using Application Insights and Azure Monitor Alert. In this article, I take a look into advanced scenario.
Metrics and Logs
When I query the Application Insights, I obviously see the "log" type of data.
However, when it looks like "metric" in the dashboard or in the alert settings. Log-based and pre-aggregated metrics in Application Insights explain the different between log and metric.
According to the article, there are two types of metrics exists.
This is the traditional (or current in my environment) metric. As name infers, metric is created based on the log file. The article says:
Using logs to retain a complete set of events can bring great analytical and diagnostic value.
But at the same time, it also says:
At the same time, collecting a complete set of events may be impractical (or even impossible) for applications that generate a lot of telemetry
This is metrics I expected, and I realize the fact that it's pre-aggregated. Yes of course, otherwise it sends too much data, and that's why it has max, min, average values. The article explains:
they are stored as pre-aggregated time series, and only with key dimensions. This makes the new metrics superior at query time.
There is one interesting important note in the article.
Important
Both, log-based and pre-aggregated metrics coexist in Application Insights. To differentiate the two, in the Application Insights UX the pre-aggregated metrics are now called "Standard metrics (preview)", while the traditional metrics from the events were renamed to "Log-based metrics".
It maybe a bit confusing to see the standard one is in preview, but at the moment, it seems "preview" is gone already.
In any case, if I understand the concept, I won't be confused.
SDK support
The article mentioned that only .NET SDK support pre-aggregated metrics so far. However I still can take advantages of the new feature as it clearly says:
while you don't benefit from the reduced volume of data transmitted over the wire, you can still use the pre-aggregated metrics and experience better performance and support of the near real-time dimensional alerting with SDKs that don't pre-aggregate metrics during collection.
This is very important as I need to get urgent alert as real-time as possible.
Create Metrics Chart and Alert
To create metric base chart, I can use Azure Monitor Metrics Explorer.
1. Go to Application Insights resource and select "Metrics".
2. I selected "standard metric" and "HTTP request execution time". Select whatever you want.
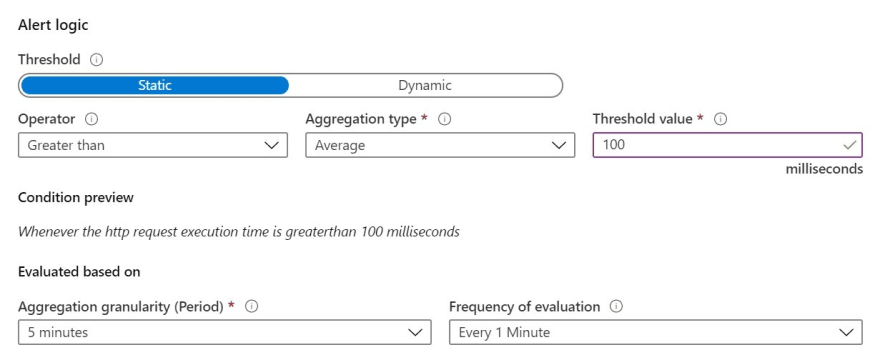
3. I can further customize the chart by splitting, applying additional filter which I can see all the detail at Advanced features of Azure Metrics Explorer. But the main purpose in this article is to create alert, I click "New alert rule" which navigated me to the "Create rule" page. I can see both RESOURCE and CONDITION are pre-filled. There is an error in condition, as I need to set threshold.
4. Click the condition to open it, and set the threshold.
The rest is same. Only difference is where I start adding the alert but it's super useful to create alert by looking into actual data.
Smart Detection
I keep explaining about how Application Insights uses Azure Monitor to send alert. But it also provides excellent out-of-box service which you cannot get without Application Insights. One of such features is Smart Detection
First thing first. How to configure it? The answer is, nothing. It's on by default and send me alert(s) by using Machine Learning, so I just need to know what kind of information I will get, and how to look into logs.
What problems are detected?
According to the article, Smart Detection detects and notifies about a variety of issues, such as:
- Smart detection - Failure Anomalies: We use machine learning to set the expected rate of failed requests for your app, correlating with load and other factors. If the failure rate goes outside the expected envelope, we send an alert.
- Smart detection - Performance Anomalies: You get notifications if response time of an operation or dependency duration is slowing down compared to historical baseline or if we identify an anomalous pattern in response time or page load time.
- General degradations and issues, like Trace degredation, Memory leak, Abnormal rise in Exception volume and Security anti-patterns.
I can see the settings from "Smart Detection" area by click "Settings".
Dynamic Threshold
Azure Monitor actually has similar capability, which is called "dynamic threshold" which I see the option several times when I create alert.
Metric Alerts with Dynamic Thresholds in Azure Monitor explains the detail.
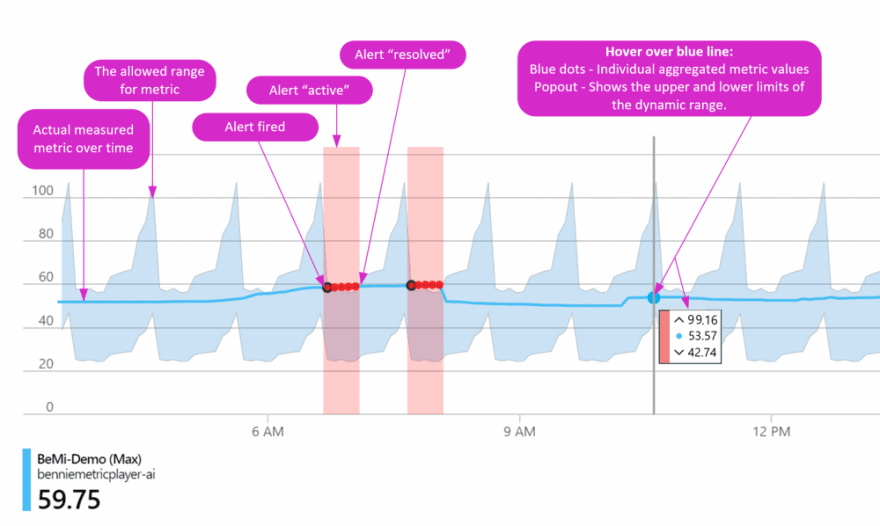
The image below illustrate the concept very well.
Use the following information to interpret the previous chart.
Blue line - The actual measured metric over time.
Blue shaded area - Shows the allowed range for the metric. As long as the metric values stay within this range, no alert will occur.
Blue dots - If you left click on part of the chart and then hover over the blue line, you see a blue dot appear under your cursor showing an individual aggregated metric value.
Pop-up with blue dot - Shows the measured metric value (the blue dot) and the upper and lower values of allowed range.
Red dot with a black circle - Shows the first metric value out of the allowed range. This is the value that fires a metric alert and puts it in an active state.
Red dots- Indicate additional measured values outside of the allowed range. They will not fire additional metric alerts, but the alert stays in the active.
Red area - Shows the time when the metric value was outside of the allowed range. The alert remains in the active state as long as subsequent measured values are out of the allowed range, but no new alerts are fired.
End of red area - When the blue line is back inside the allowed values, the red area stops and the measured value line turns blue. The status of the metric alert fired at the time of the red dot with black outline is set to resolved.
As you can see, this types of metrics behavior is very hard to set "static alert". It may require many data to start working more precisely, but it worse trying.
Summary
In this article, I explain advanced features of Application Insights and Azure Monitor Alert. I love smart detection and dynamic alert as it's so easy to set, but I need to understand what kind of alert I can get.
In the next article, I will explain how to "optimize" alerts.


Top comments (0)