
Fixing memory leaks may not be not the shiniest skill on a CV, but when things go wrong on production, it's better to be prepared!
After reading this article, you'll be able to monitor, understand, and debug the memory consumption of a Node.js application.
When Memory Leaks Become A Problem
Memory leaks often go unnoticed. They become a problem when someone pays extra attention to the production performance metrics.
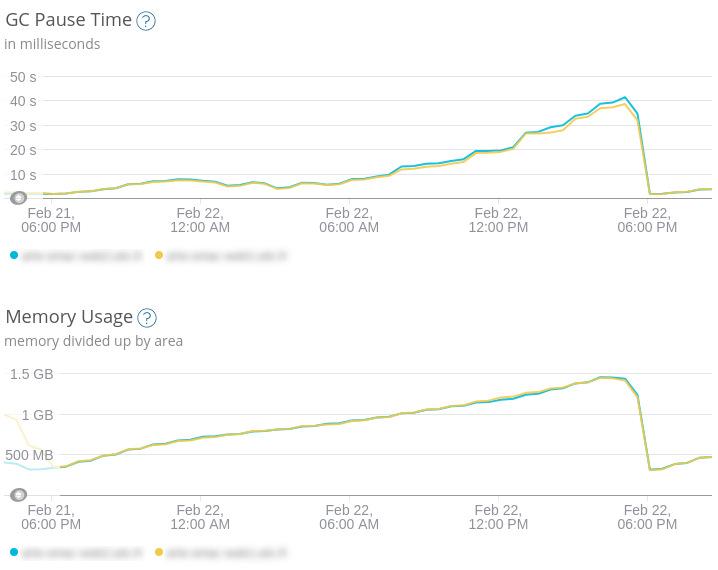
The first symptom of a memory leak on a production application is that memory, CPU usage, and the load average of the host machine increase over time, without any apparent reason.
Insidiously, the response time becomes higher and higher, until a point when the CPU usage reaches 100%, and the application stops responding. When the memory is full, and there is not enough swap left, the server can even fail to accept SSH connections.
But when the application is restarted, all the issues magically vanish! And nobody understands what happened, so they move on other priorities, but the problem repeats itself periodically.
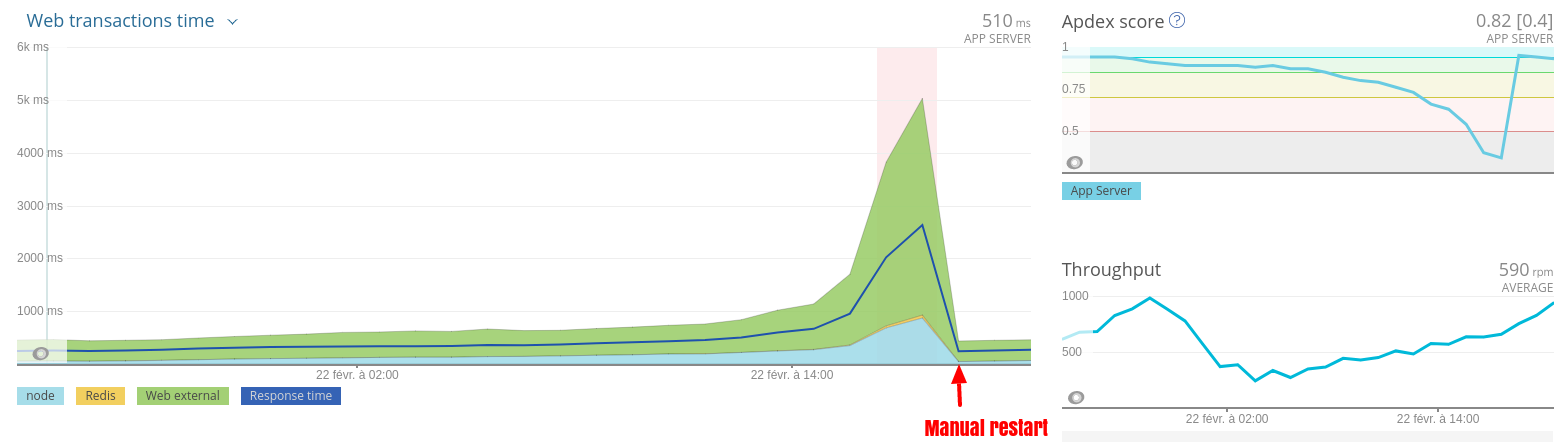
Memory leaks aren't always that obvious, but when this pattern appears, it's time to look for a correlation between the memory usage and the response time.
Congratulations! You've found a memory leak. Now the fun begins for you.
Needless to say, I assumed that you monitor your server. Otherwise, I highly recommend taking a look at New Relic, Elastic APM, or any monitoring solution. What can't be measured can't be fixed.
Restart Before It's Too Late
Finding and fixing a memory leak in Node.js takes time - usually a day or more. If your backlog can't accomodate some time to investigate the leak in the near future, I advise to look for a temporary solution, and deal with the root cause later. A rational way (in the short term) to postpone the problem is to restart the application before it reaches the critical bloat.
For PM2 users, the max_memory_restart option is available to automatically restart node processes when they reach a certain amount of memory.
Now that we're comfortably seated, with a cup of tea and a few hours ahead, let's dig into the tools that'll help you find these little RAM squatters.
Creating An Effective Test Environment
Before measuring anything, do yourself a favor, and take the time to set up a proper test environment. It can be a Virtual Machine, or an AWS EC2 instance, but it needs to repeat the exact same conditions as in production.
The code should be built, optimized, and configured the exact same way as when it runs on production in order to reproduce the leak identically. Ideally, it's better to use the same deployment artifact, so you can be certain that there is no difference between the production and the new test environment.
A duly configured test environment is not enough: it should run the same load as the production, too. To this end, feel free to grab production logs, and send the same requests to the test environment. During my debugging quest, I discovered siege an HTTP/FTP load tester and benchmarking utility, pretty useful when it comes to measuring memory under heavy load.
Also, resist the urge to enable developer tools or verbose loggers if they are not necessary, otherwise you'll end up debugging these dev tools!
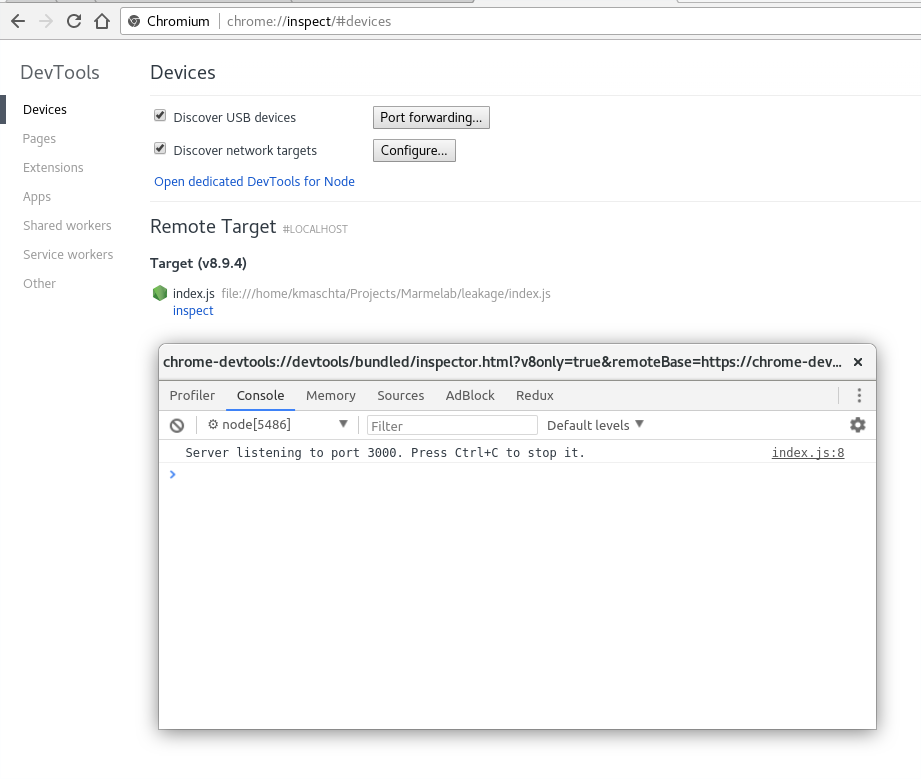
Accessing Node.js Memory Using V8 Inspector & Chrome Dev Tools
I love the Chrome Dev Tools. F12 is the key that I type the most after Ctrl+C and Ctrl+V (because I mostly do Stack Overflow-Driven Development - just kidding).
Did you know that you can use the same Dev Tools to inspect Node.js applications? Node.js and Chrome run the same engine, Chrome V8, which contains the inspector used by the Dev Tools.
For educational purposes, let's say that we have the simplest HTTP server ever, with the only purpose to display all the requests that it has ever received:
const http = require('http');

const requestLogs = [];
const server = http.createServer((req, res) => {
    requestLogs.push({ url: req.url, date: new Date() });
    res.end(JSON.stringify(requestLogs));
});

server.listen(3000);
console.log('Server listening to port 3000. Press Ctrl+C to stop it.');
In order to expose the inspector, let's run Node.js with the --inspect flag.
$ node --inspect index.js
Debugger listening on ws://127.0.0.1:9229/655aa7fe-a557-457c-9204-fb9abfe26b0f
For help see https://nodejs.org/en/docs/inspector
Server listening to port 3000. Press Ctrl+C to stop it.
Now, run Chrome (or Chromium), and go to the following URI: chrome://inspect. Voila! A full-featured debugger for your Node.js application.
Taking Snapshots Of The V8 Memory
Let's play with the Memory tab a bit. The simplest option available is Take heap snapshot. It does what you expect: it creates a dump of the heap memory for the inspected application, with a lot of details about the memory usage.
Memory snapshots are useful to track memory leaks. A usual technique consists of comparing multiple snapshots at different key points to see if the memory size grows, when it does, and how.
For example, we'll take three snapshots: one after the server start, one after 30 seconds of load, and the last one after another session of load.
To simulate the load, I'll use the siege utility introduced above:
$ timeout 30s siege http://localhost:3000

** SIEGE 4.0.2
** Preparing 25 concurrent users for battle.
The server is now under siege...
Lifting the server siege...
Transactions:               2682 hits
Availability:             100.00 %
Elapsed time:              30.00 secs
Data transferred:         192.18 MB
Response time:              0.01 secs
Transaction rate:          89.40 trans/sec
Throughput:             6.41 MB/sec
Concurrency:                0.71
Successful transactions:        2682
Failed transactions:               0
Longest transaction:            0.03
Shortest transaction:           0.00
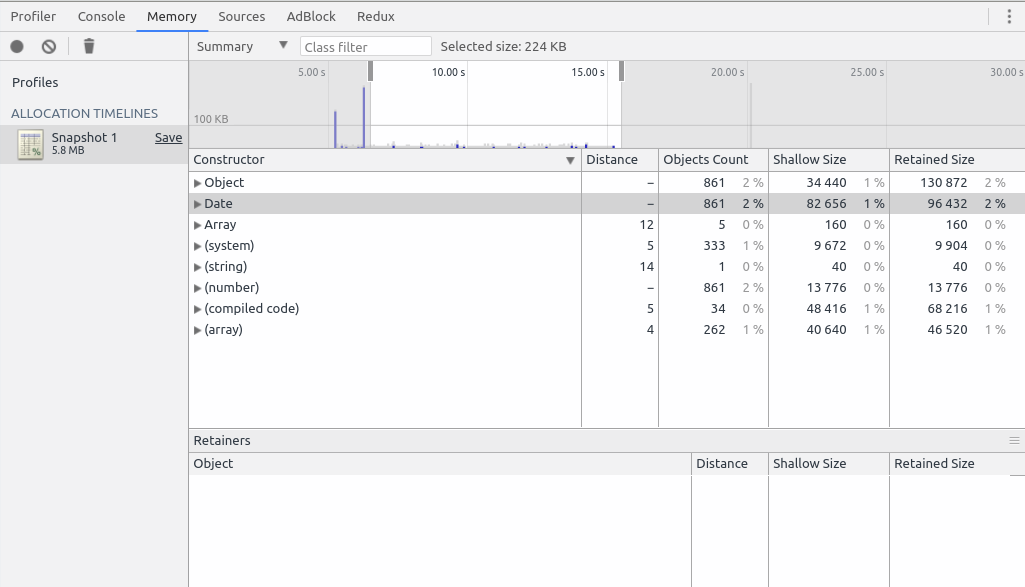
Here is the result of my simulation (click to see the full size):
A lot to see!
On the first snapshot, there are already 5MB allocated before any request is processed. It's totally expected: each variable or imported module is injected into memory. Analysing the first snapshot allows optimizing the server start for example - but that's not our current task.
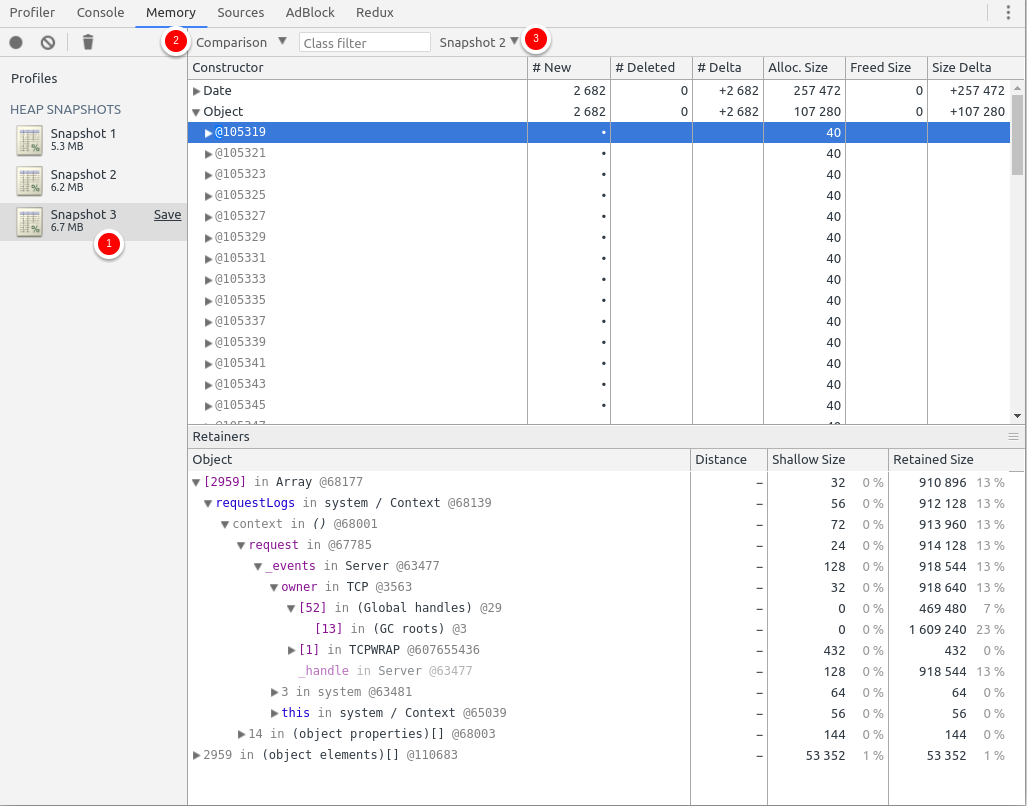
What interests me here is to know if the server memory grows over time while it's used. As you can see, the third snapshot has 6.7MB while the second has 6.2MB: in the interval, some memory has been allocated. But which function did?
I can compare the difference of allocated objects by clicking on the latest snapshot (1), change the mode for Comparison (2), and select the Snapshot to compare with (3). This is the state of the current image.
Exactly 2,682 Date objects and 2,682 Objects have been allocated between the two load sessions. Unsurprisingly, 2,682 requests have been made by siege to the server: it's a huge indicator that we have one allocation per request. But all "leaks" aren't that obvious so the inspector shows you where it was allocated: in the requestLogs variable in the system Context (it's the root scope of the app).
Tip: It's normal that V8 allocates memory for new objects. JavaScript is a garbage-collected runtime, so the V8 engine frees up memory at regular intervals. What's not normal is when it doesn't collect the allocated memory after a few seconds.
Watching Memory Allocation In Real Time
Another method to measure the memory allocation is to see it live instead of taking multiple snapshots. To do so, click on Record allocation timeline while the siege simulation is in progress.
For the following example, I started siege after 5 seconds, and during 10 seconds.
For the firsts requests, you can see a visible spike of allocation. It's related to the HTTP module initialization. But if you zoom in to the more common allocation (such as on the image above) you'll notice that, again, it's the dates and objects that take the most memory.
Using The Heap Dump Npm Package
An alternative method to get a heap snapshot is to use the heapdump module. Its usage is pretty simple: once the module is imported, you can either call the writeSnapshot method, or send a SIGUSR2 signal to the Node process.
Just update the app:
const http = require('http');
const heapdump = require('heapdump');

const requestLogs = [];
const server = http.createServer((req, res) => {
    if (req.url === '/heapdump') {
        heapdump.writeSnapshot((err, filename) => {
            console.log('Heap dump written to', filename)
        });
    }
    requestLogs.push({ url: req.url, date: new Date() });
    res.end(JSON.stringify(requestLogs));
});

server.listen(3000);
console.log('Server listening to port 3000. Press Ctrl+C to stop it.');
console.log(`Heapdump enabled. Run "kill -USR2 ${process.pid}" or send a request to "/heapdump" to generate a heapdump.`);
And trigger a dump:
$ node index.js
Server listening to port 3000. Press Ctrl+C to stop it.
Heapdump enabled. Run "kill -USR2 29431" or send a request to "/heapdump" to generate a heapdump.

$ kill -USR2 29431
$ curl http://localhost:3000/heapdump
$ ls
heapdump-31208326.300922.heapsnapshot
heapdump-31216569.978846.heapsnapshot
You'll note that running kill -USR2 doesn't actually kill the process. The kill command, despite its scary name, is just a tool to send signals to processes, by default a SIGTERM. With the argument -USR2, I choose to send a SIGUSR2 signal instead, which is a user-defined signal.
In last resort, you can use the signal method to generate a heapdump on the production instance. But you need to know that creating a heap snapshot requires twice the size of the heap at the time of the snapshot.
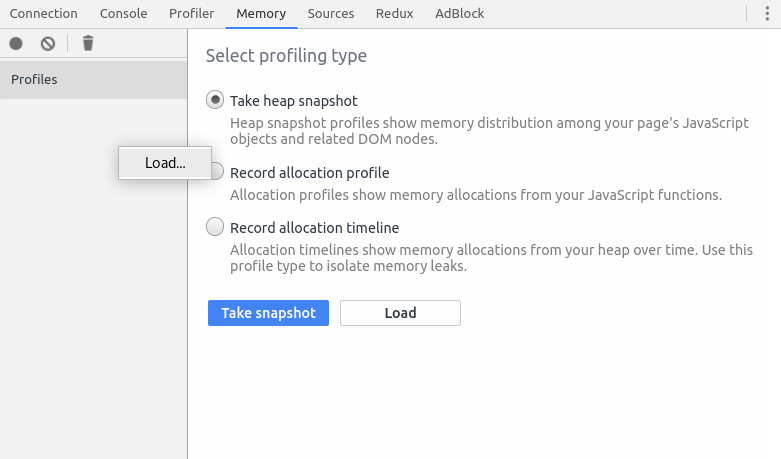
Once the snapshot is available, you can read it with the Chrome DevTools. Just open the Memory tab, right-click on the side and select Load.
Fixing the Leak
Now that I have identified what grows the memory heap, I have to find a solution. For my example, the solution is to store the logs not in memory, but on the filesystem. On a real project, it's better to delegate log storage to another service like syslog, or use an appropriate storage like a database, a Redis instance, or whatever.
Here is the modified web server with no more memory leak:
// Not the best implementation. Do not try this at home.
const fs = require('fs');
const http = require('http');

const filename = './requests.json';

const readRequests = () => {
    try {
        return fs.readFileSync(filename);
    } catch (e) {
        return '[]';
    }
};

const writeRequest = (req) => {
    const requests = JSON.parse(readRequests());
    requests.push({ url: req.url, date: new Date() });
    fs.writeFileSync(filename, JSON.stringify(requests));
};

const server = http.createServer((req, res) => {
    writeRequest(req);
    res.end(readRequests());
});

server.listen(3000);
console.log('Server listening to port 3000. Press Ctrl+C to stop it.');
Now, let's run the same test scenario as before, and measure the outcome:
$ timeout 30s siege http://localhost:3000

** SIEGE 4.0.2
** Preparing 25 concurrent users for battle.
The server is now under siege...
Lifting the server siege...
Transactions:               1931 hits
Availability:             100.00 %
Elapsed time:              30.00 secs
Data transferred:        1065.68 MB
Response time:              0.14 secs
Transaction rate:          64.37 trans/sec
Throughput:            35.52 MB/sec
Concurrency:                9.10
Successful transactions:        1931
Failed transactions:               0
Longest transaction:            0.38
Shortest transaction:           0.01

As you can see, the memory growth is far slower! This is because we no longer store the request logs in memory (inside the requestLogs variable) for each request.
This said, the API takes more time to respond: I had 89.40 transactions per second, now we have 64.37.
Reading and writing to the disk comes with a cost, so do other API calls or database requests.
Note that it's important to measure memory consumption before and after a potential fix, in order to confirm (and prove) that the memory issue is fixed.
Conclusion
Actually, fixing a memory leak once it's been identified is somewhat easy: use well known and tested libraries, don't copy or store heavy objects for too long, and so on.
The hardest part is to find them. Fortunately, and despite few bugs, the current Node.js tools are neat. And now you know how to use them!
To keep this article short and understandable, I didn't mention some other tools like the memwatch module (easy) or Core Dump analysis with llnode or mdb (advanced) but I let you with more detailed readings about them:
Further reading:
- Debugging Memory Leaks in Node.js Applications by Vladyslav Millier
- Understanding Garbage Collection and Hunting Memory Leaks in Node.js by Daniel Khan
- llnode for Node.js Memory Leak Analysis by Brendan Gregg
- Debugging Node.js applications using core dumps by Antti Risteli

Top comments (5)
Very useful information. Thank you.
"What can't be measured can't be fixed." tooo tru
You're right, it's better! But it will never be as fast as writing in memory.