
1. Introduction
Most of the day-to-day database users can make do with the standard database functionality. Want to get all the friends of a certain user? Just join the users table with the friends table and there you have it (btw — it’s never that simple). If you’re a more advanced user, you might use aggregations and ordering.
However, sometimes you can’t get the insights you want with just joins and aggregations. When I faced such a problem, my first instinct was to load all the data into a simple python/javascript/ruby/(favorite dynamic programming language) and calculate it there. But it meant loading a big amount of data into the script, while losing the parallel computation power BigQuery has to offer. Also, it meant more moving parts in the system and more deployment details.
That’s when a simple google search (I think it was “BigQuery calculate row based on other rows”) led me to BigQuery Analytic Functions (the concept is not specific to BigQuery).
In this post, I will describe what these functions are, what was the problem I was trying to solve, how I solved it with Analytic functions and my conclusions from the process.
Ok then…
2. The problem at hand (simplified)
The dataset I was working with is local rain data. It basically has three columns: date, location and amount. Each row represents the amount of rain (in mm) that poured on each date in a certain location.
What I wanted to extract was an aggregation by “rain events” in a location. A “rain event” is defined as one or more consecutive days of rain. Once there’s a rain-free day, the event is over. That means I would like to aggregate together consecutive rainy days and get the average and total rain for each “rain event”.
Let’s take a look at a quick example. The dataset:

We can see three different rain events (consecutive days of rain):
- 2019–01–01 to 2019–01–03 in New York
- 2019–03–31 to 2019–04–01 in New York
- 2019–05–25 to 2019–05–27 in LA
And the resulting table I wished to get from the input dataset should look something like:

How can this be calculated with an SQL query? Grouping by month or week won’t work. As far as I saw, the best choice was to use Analytic Functions.
3. Analytic functions: description and syntax
Analytic functions perform operations on groups of rows, same as aggregations (GROUP BY and the likes). There are two major differences:
a. Analytic functions return a single value for each of the input rows.
b. The group of rows for the operation is defined using a window.
Analytic functions are added as part of the SELECT clause, and with them, one has to specify three parameters:
a. The partition (breaks input table into different groups).
b. The order (orders the rows in each partition); Order influences the operation’s result, as we’ll see later.
c. The window — each row is operated on with a group of other rows, which are defined by the window parameter.
Let’s have a look at a simple example and explain the syntax:
SELECT
SUM(amount) OVER (PARTITION BY location ORDER BY date ROWS BETWEEN 1 PRECEDING AND 1 FOLLOWING)
FROM rain_data
The partition and order parts are pretty clear, just mention the column names like ordinary GROUP BY and ORDER BY inputs.
The window part needs some explaining: it states that for each row, the operation should look at a window which includes the row itself, one row before it (1 PRECEDING), and one row after it (1 FOLLOWING). So the operation calculates the sum of three rows, but it does that for every row in the input table and gives the fitting result for each row.
The flow (leaving out the order part) is depicted in the following chart:
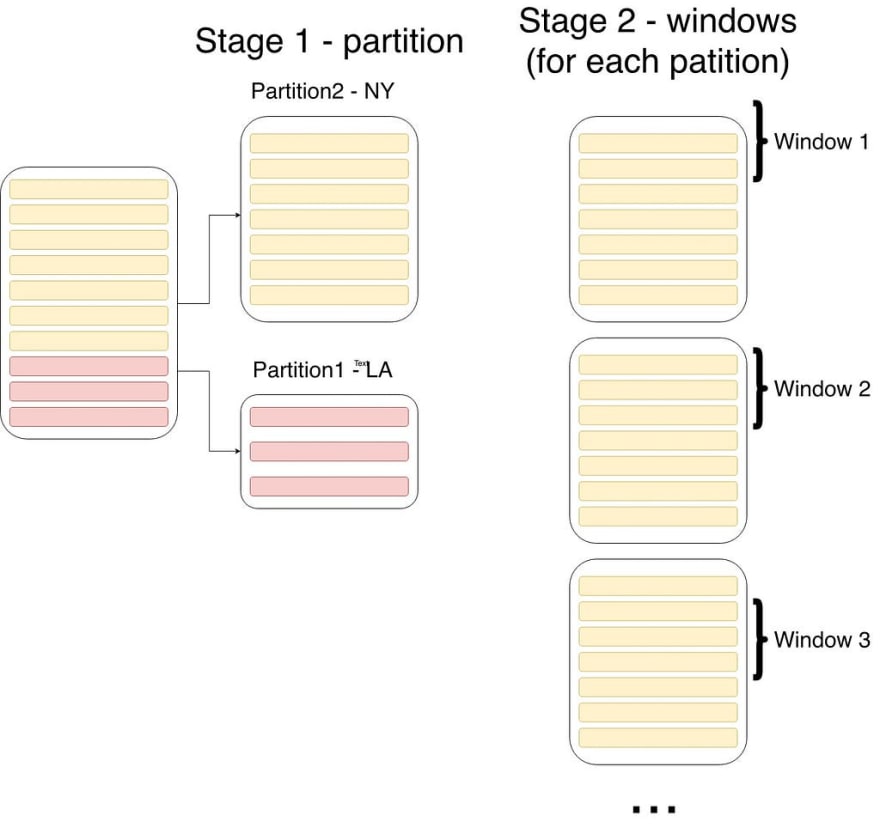
More information on the syntax can be found in the BigQuery documentation (it’s not that bad): https://cloud.google.com/bigquery/docs/reference/standard-sql/analytic-function-concepts
The example query did not solve my problem. What did solve my problem? On to the next section.
4. Solving the problem
So how can Analytic functions help? In my case, I wanted to partition by location, order by date, and use a window of two rows.
Why two rows? For each row we would calculate the date difference between the current row and the previous one. If the difference is larger than a single day, then it belongs to a different rain event.
Lucky for me, BigQuery has a built-in Analytic function for working with the previous row: the LAG function (for some reason it is called a navigation function). The LAG function references the previous row, according to a provided Partition and Order (a window is not necessary!).
So Let’s see how the initial query looks like:
SELECT * FROM (
SELECT *,
DATE_DIFF(date, LAG(date) OVER(PARTITION BY location ORDER BY date), day) AS days_from_last_rain
FROMrain_example
) AS t
WHERE
days_from_last_rain > 1
OR days_from_last_rain IS NULL
The result of this query (on the example table above):

This is the set of rainy days that were the first in a rain event. We got it by selecting the diff between the date of the previous row and the date of the current row. We then filtered all those with a diff of 1 day, as those have preceding rainy days.
Now we can connect each rainy day from the original dataset to the correct rain event, and aggregate each group to get the average and sum
5. Conclusions
There’s a bunch of ‘hidden’ functionality when you dive into the BigQuery documentation (or any other database for that matter). So next time before you load data into a script and start hacking, give the documentation a look (or just google it).

Latest comments (0)