
“Are we on track to deliver XYZ feature by the deadline?”
For software development leaders, this is the question we get most.
We get it from the CEO.
We get it from the other VPs.
We get it over Slack from the PMs and SREs.
We get it from our technical support leads as we pass them in the hallway.
We get it by text message early in the morning from a sales rep who is on-site with a big prospect.
As a VP of Engineering, I never thought much about it. I accepted this question as part of my job. Part of my life. THIS IS THE WAY.
Then one day I did think about it. And I realized this question was a symbol representing a lot of big challenges I was battling on a day to day basis:
My boss (our CEO) didn’t understand what we really do, or how to help.
My peers (the other VPs) thought of me and my org as more tactical than strategic.
My team (our devs) didn’t feel appreciated enough.
Our company (all of the people) only measured us by our output not our process.
You want to know the biggest problem of all? I wasn’t actually good at answering the question!
Forecasting is hard. Sometimes we delivered right on time. Half of the time we missed our date. Sometimes we missed it by a lot. I had a good team and we always had legitimate reasons. But the business didn’t understand the complexities of predicting delivery dates and I always felt like I lost a tiny bit of credibility with them every time I had to push back a deadline.
Our business and our engineering team didn’t share a common language so important information was getting lost in translation.
I realized they only asked me about feature delivery dates because they didn’t know what else to ask. I was actually encouraging this behavior because I never took the time to teach them the right questions to ask.
Think about it…
The CEO doesn’t ask the VP of Sales “are we going to hit our number?” because they already know the answer. Every week in the executive staff meeting the VP of Sales pulls up their Salesforce dashboard and shows something like this for the current quarter:

All of these metrics are leading indicators of sales performance for the quarter. The CEO doesn’t wait until after the quarter is over to measure the performance of the sales team. They want to know ahead of time if there are any problems. If there are, they want to know how they can help.
If the CEO doesn’t fully understand how the current quarter leading indicators will translate to the bottom line at quarter-end, they ask insightful questions like:
“We’re at 85% of quota with 17 days to go. How does that compare to previous quarters?”
“I see we have more high-risk big deals than normal. Do you need me to visit any of those customers?”
This is a constructive conversation and the type I wanted to be having with the CEO.
Engineering leaders need to communicate their business with data
So I decided every week I would bring some kind of data to the CEO’s weekly meeting.
I focused on two sets of engineering-specific metrics that were most closely related to what the business cared about, and were leading indicators of success for my organization:
Cycle Time and Investment Profile
Cycle Time
Cycle Time measures the amount of time it takes for a given team to deliver a piece of work from the time they start working on it until it’s in the hands of your external/internal customer (from first branch commit to release).
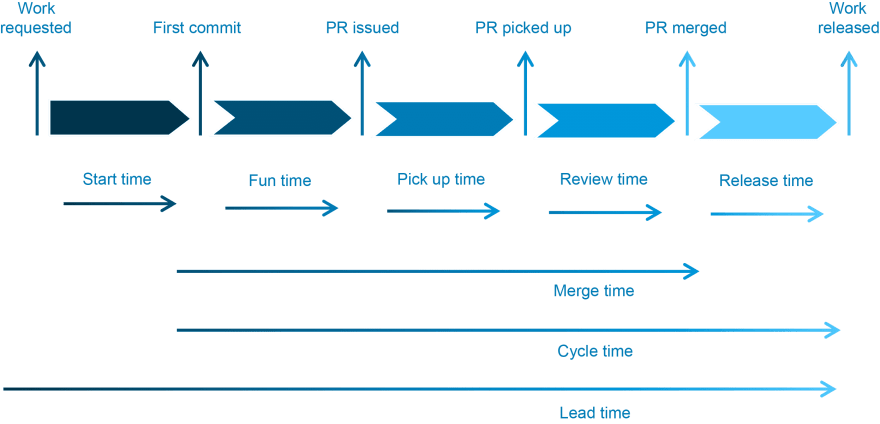
Cycle time is a great high-level engineering metric. It can also be broken down into different components, as seen above.
It shows the major aspects of the development process – both human and automated – and is the best measure of development team efficiency or “health”.
How to use it in the CEO’s staff meeting:
Cycle time length is to a development task what sales cycle length is to a customer deal. That’s why everyone in the executive room will understand it.
They’ll care because it is a leading indicator of how fast your team can implement a new idea, respond to a customer feature request or fix a bug.
Show cycle time from week to week or iteration to iteration to visualize how your team is trending. If things are going well, you can celebrate your team’s success. If things are going in the wrong direction, you can take control of the conversation and proactively talk about what you’re doing to fix it and what help/resources you need to get it done.
Show the phases of the cycle (i.e. fun time AKA coding time, review time, release time etc) to highlight bottlenecks in the delivery process and ask for help. For example, if release time is slowing things down, you have concrete data to suggest an investment in continuous deployment. You will bring confidence to your executive team because you have the data to back up the investment payoff (your cycle time trend in each weekly executive meeting).
Show cycle time broken down by teams, squads, projects or geographic area. You can illustrate the effect of a new team leader with a newly forming team or the effect of a focused long-living team. Or even how the non-functional investment to break out an important service for an autonomous team has positively influenced cycle time.
Investment Profile
Investment Profile shows the types of work your team is executing on. It is commonly broken down by stories, non-functional, bugs, support, customer commitments, and hotfixes. You may have additional categories specific to your business. Some examples include:
Security: Some companies like to see the work they are doing to improve security and compliance.
Cost reduction: I worked with a CFO once who wanted to see engineering projects that were designed to reduce our infrastructure hosting costs.
Innovation: One CEO I worked for wanted to see how much we were investing in forward-looking, innovative projects – in other words, big ideas.

Investment profile measures how much time is spent on each type of task
How to use it in the CEO’s staff meeting:
Once the execs know what all of your categories mean (i.e. non-functional work is stuff that is important to the back-end of how our product runs but that customers don’t really see like scaling infrastructure), they get this right away.
Different execs will care for different reasons.
Your VP of Product will first applaud and then have your back when needed.
Your VPs of Marketing and Sales will probably want to know how much time was spent delivering new features.
Your VP of Customer Success might be more focused on time spent on bug fixes and site reliability.
And this is exactly the conversation you want to encourage – how to balance between competing priorities to drive the best result for your customers and the company.
Show investment profile from week to week or iteration to iteration to explain why more or fewer features were delivered in any given period of time. It will be easier for them to swallow the decision to scale back the functionality of a new feature in order to ensure the reliability and uptime of your product.
Show the ratio of sales requests to innovation tasks to highlight how responsive you are to sales needs. Some of the business may view this as a positive signal that you are responsive to customers. Others may want to scale back the number of requests from sales in order to work on forward-looking, innovative ideas. The most important thing is that you are now having a positive, strategic conversation, owned and led by you!
Cross-reference Investment Profile with Cycle Time. Investment Profile is an important leading indicator of Cycle Time so viewing them together adds additional context about trends in your delivery. For example, if you invest in non-functional work to remove delivery bottlenecks (e.g. automation) you’ll probably start to see cycle time get faster.
The holy grail is when your CEO encourages you to invest more in non-functional work now so you can speed up your cycle time and deliver more features over time. After consistently showing Investment Profile in the exec meeting, this did happen to me!

All of the objections
I know what some of you are thinking..
“My CEO only cares about the bottom line.”
This could be true. And it actually doesn’t matter either way. The data that you are bringing to your executive meetings drive the bottom line. That’s the point. CEOs care about leading metrics that drive the bottom line, and arguably, the best CEOs care more about these leading indicators than the bottom line. Trust me, your CEO will feel good about understanding the process more and knowing how to help when needed.
“We are going through a transition. I’ll start measuring after.”
I’ve heard this one a few times. “We are forming new teams, I’ll start once everything gets settled, or “we are working on a new CI/CD initiative, I’ll start measuring a few months after.” It’s natural to feel that starting to be data driven while things are in transition is not the right time. The fact is, any transition period is actually the best time to start. It allows you to track your improvement throughout the transition. For example, if you have a CI/CD initiative, this is the perfect time to start measuring your cycle time so that you can visualize and track your improvement.
“The data right now won’t make my team look very good.”
This is interesting. What does your team look like now without data? Invisible. The truth is it’s not about “good” and “bad”. It’s about baselining for continuous improvement and being proactive with the health of your software team. Being data-driven in your executive meeting will make you look good and will allow your peers to help your organization improve in areas of need.
You’re proactive and strategic
Sharing this data every week in the CEO’s staff meeting will get your peers out of the business of only asking you if the feature is on time and get you out of the business of constantly being on the defensive. Forecasting delivery dates will always be difficult, but focusing on the leading data indicators will actually help you hit more deadlines while improving the conversation at your executive table.
Your CEO and peers will gain an understanding of what actually drives performance in your organization. Your team will feel more appreciated because you’re emphasizing measuring the process (cycle time, investment profile) and not just the output (when the thing is going to be delivered).
Bringing data to your executive table will allow you to be more strategic to the business and not just a tactical execution machine. Starting with Cycle Time and Investment Profile will open doors for you to further contribute strategically and lay a path for the next metrics you want to bring to the table.

Time for your next CEO staff meeting. Are you ready?
How to do it
I used spreadsheets to track this data before. It was painful. I was never sure if I could trust the data from Jira because it wasn’t fully updated. And it took a data engineer hours to manually collect data from each team at the end of each iteration.
That’s why I founded LinearB. We automate the whole process. You can see your team’s Cycle Time and Investment Profile right now with our free trial. Check it out and email if you want tips for how to present it at your CEO’s next exec meeting: dan@linearb.io.
Want to meet and get a demo of LinearB? Set your meeting with me now.


Top comments (0)