
Written by Sampath Gajawada✏️
If your JavaScript application is experiencing frequent crashes, high latency, and poor performance, one potential cause could be memory leaks. Memory management is often neglected by developers due to misconceptions of automatic memory allocation by JavaScript engines, leading to memory leaks and, ultimately, poor performance.
In this article, we’ll explore memory management, types of memory leaks, and hunting memory leaks in JavaScript using Chrome DevTools. Let’s get started!
- What are memory leaks?
- Memory lifecycle
- Memory allocation
- Garbage collector
- Types of memory leaks
- Undeclared or accidental global variables
- Closures
- Forgotten timers
- Out of DOM reference
- Identify memory leaks using Chrome DevTools
What are memory leaks?
In simple words, a memory leak is an allocated piece of memory that the JavaScript engine is unable to reclaim. The JavaScript engine allocates memory when you create objects and variables in your application, and it is smart enough to clear out the memory when you no longer need the objects. Memory leaks are caused due to flaws in your logic, and they make way for poor performance in your application.
Before jumping into the different types of memory leaks, let’s have a clear picture of memory management and garbage collection in JavaScript.
Memory lifecycle
In any programming language, memory lifecycle consists of three steps:
- Memory allocation: the operating system allocates memory to the program during execution as needed
- Use memory: your program uses previously allocated memory. Your program can perform
readandwriteactions on the memory - Release memory: once your task is finished, allocated memory is released and becomes free. In high-level languages like JavaScript, memory release is handled by the garbage collector
If you understand how memory allocation and release happens in JavaScript, it’s very easy to solve memory leaks in your application.
Memory allocation
JavaScript has two storage options for memory allocation. One is the stack, and the other is the heap. All the primitive types, like number, Boolean, or undefined will be stored on the stack. Heap is the place for reference types like objects, arrays, and functions.
Stack
Stack follows the LIFO approach to allocate memory. All the primitive types like number, Boolean, and undefined can be stored under the stack:

Heap
Reference types like objects, arrays, and functions are stored on the heap. The reference types' size cannot be determined at compile time, so memory is allocated based on the objects’ usage. The reference of object is stored on the stack and the actual object is stored on the heap:
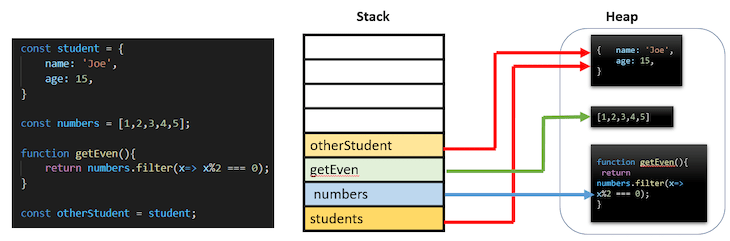
In the image above, the otherStudent variable is created by copying the student variable. In this scenario, otherStudent is created on the stack, but it points to the student reference on the heap.
We’ve seen that the main challenge for memory allocation in the memory cycle is when to release the allocated memory and make it available for other resources. In this scenario, garbage collection comes to the rescue.
Garbage collector
The main cause of memory leaks in an application is due to unwanted references. The garbage collector finds the memory that is no longer in use by the program and releases it back to the operating system for further allocation.
To know what is an unwanted reference, first, we need to get an idea of how garbage collection determines that a piece of memory is unreachable. Garbage collection uses two main algorithms to find unwanted references and unreachable code, reference count and mark-and-sweep.
Reference count
The reference count algorithm looks for objects that have no references. An object can be released if it has zero references pointing to it.
Let’s understand this better with the example below. There are three variables, student, otherStudent, which is a copy of student, and sports, which takes the array of sports from the student object:
let student = {
    name: 'Joe',
    age: 15,
    sports: ['soccer', 'chess']
}
let otherStudent = student;
const sports = student.sports;
student = null;
otherStudent = null;
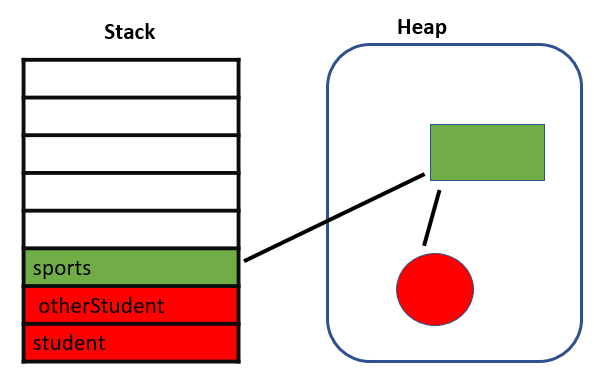
In the code snippet above, we assigned student and otherStudent variables to nulls, telling us these objects have no references to it. The memory that is allocated for them in the heap, which is in red , can be released easily as it has zero references.
On the other hand, we have another block of memory in the heap, which cannot be released because it has the sports object reference.
When two objects refer to themselves, there is a problem with the reference count algorithm. In simple terms, if there are cyclic references, this algorithm fails to determine free objects.
In the example below, person was assigned to employee and employee to person, so these objects are referring to each other:
let person = {
    name: 'Joe'
};
let employee = {
    id: 123
};
person.employee = employee;
employee.person = person;
person = null;
employee = null;
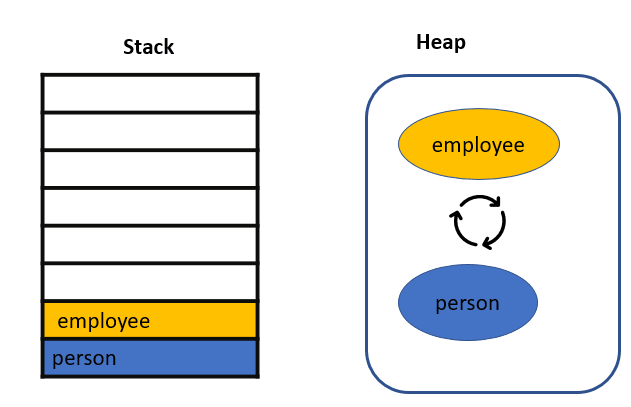
After making these objects null, they will lose the reference on the stack, but the objects still stay on the heap since they have the cyclic reference. The reference algorithm could not release these objects since they have a reference. The cyclic reference problem can be solved using the mark-and-sweep algorithm.
Mark-and-sweep algorithm
The mark-and-sweep algorithm reduces the definition of an unnecessary object to an unreachable object. If the object is not reachable, the algorithm considers this object unnecessary:

The mark-and-sweep algorithm follows two steps. First, in JavaScript, the root is the global object. The garbage collector periodically starts from the root and finds all objects that are referenced from the root. It will mark all the reachable objects active. Then, garbage collection frees the memory for all objects that are not marked as active, returning the memory to the operating system.
Types of memory leaks
We can prevent memory leaks by understanding how unwanted references are created in JavaScript. The following scenarios cause unwanted references.
Undeclared or accidental global variables
One of the ways in which JavaScript is permissive is in the way it handles undeclared variables. A reference to an undeclared variable creates a new variable inside the global object. If you create a variable without any reference, its root would be the global object.
As we just saw in the mark-and-sweep algorithm, the references that are directly pointed to the root are always active, and the garbage collector cannot clear them, resulting in a memory leak:
function foo(){
    this.message = 'I am accidental variable';
}
foo();
As a solution, try to nullify these variables after use, or add use strict to enable a stricter mode of JavaScript that prevents accidental global variables.
Closures
A closure is a combination of a function bundled together or enclosed with references to its surrounding state, the lexical environment. In simple terms, a closure is an inner function that has access to the outer function’s scope.
Function scoped variables get cleaned up after the function has exited the call stack, whereas a closure keeps the outer scope variables referenced after its execution. Outer scope variables reside in the memory even though they are unused, so this is a common cause for memory leaks:
function outer(){
    const largeArray = []; // unused array
    return function inner(num){
        largeArray.push(num);
    }
}
const appendNumbers = outer(); // get the inner function
// call the inner function repeatedly
for (let i=0; i< 100000000; i++){
    appendNumbers(i);
}
In the example above, largeArray is never returned and cannot be reached by garbage collector, significantly increasing its size through repeated calls of inner functions, resulting in a memory leak.
Closures are unavoidable, so make sure the variables in the outer scope are either used or returned.
Forgotten timers
setTimeout and setInterval are the two timing events available in JavaScript. The setTimeout function executes when the given time is elapsed, whereas setInterval executes repeatedly for the given time interval. These timers are the most common cause of memory leaks.
If we set the recurring timer in our code, the reference to the object from the timer’s callback stays active until the timer stops:
function generateRandomNumbers(){
    const numbers = []; // huge increasing array
    return function(){
        numbers.push(Math.random());
    }
}
setInterval((generateRandomNumbers(), 2000));
In the example above, generateRandomNumbers returns a function that appends random numbers to the outer scope numbers array. By using setInterval on this function, it calls on the specified interval periodically and results in a huge size for numbers array.
To solve this issue, best practice requires providing references inside the setTimeout or setInterval calls. Then, make an explicit call to clear the timers. For the above example, the solution is below:
const timer = setInterval(generateRandomNumbers(), 2000); // save the timer
    // on any event like button click or mouse over etc
    clearInterval(timer); // stop the timer
Out of DOM reference
Out of DOM reference indicates nodes that have been removed from the DOM but are still available in the memory. The garbage collector cannot release these DOM objects since they are being referred to as object graph memory. Let’s understand this with an example below:
let parent = document.getElementById("#parent");
let child = document.getElementById("#child");
parent.addEventListener("click", function(){
    child.remove(); // removed from the DOM but not from the object memory
});
In the code above, we removed the child element from the DOM on click of the parent, but the child variable still holds the memory because the event listener is always active, and it holds the child reference. For this reason, the garbage collector cannot release the child object and will continue to consume the memory.
You should always unregister the event listeners once they are no longer needed by creating the reference for the event listener and passing it to the removeEventListener method:
function removeChild(){
    child.remove();
}
parent.addEventListener("click", removeChild);
// after completing required action
parent.removeEventListener("click", removeChild);
Identify memory leaks using Chrome DevTools
Debugging memory issues is really a tough job, but we can identify the memory graph and a few memory leaks using Chrome DevTools. We’ll focus on two important aspects of our daily lives as developers:
- Visualize memory consumption using the performance profiler
- Identify Detached DOM nodes.
Visualize memory consumption using the performance profiler
Let’s consider the following code snippet as an example. There are two buttons, Print Numbers and Clear. With a click on the Print Numbers button, numbers from 1 to 10,000 are appended to the DOM by creating paragraph nodes and pushing some huge strings to the global variable.
The Clear button will clear the global variable and override the document body but not remove the nodes created on clicking Print:
<!DOCTYPE html>
<html lang="en">
<head>
    <title>Memory leaks</title>
</head>
<body>
<button id="print">Print Numbers</button>
<button id="clear">Clear</button>
</body>
</html>
<script>
    var longArray = [];

    function print() {
      for (var i = 0; i < 10000; i++) {
          let paragraph = document.createElement("p");
          paragraph.innerHTML = i;
         document.body.appendChild(paragraph);
      }
      longArray.push(new Array(1000000).join("y"));
    }

    document.getElementById("print").addEventListener("click", print);
    document.getElementById("clear").addEventListener("click", () => {
      window.longArray = null;
      document.body.innerHTML = "Cleared";
    });
</script>
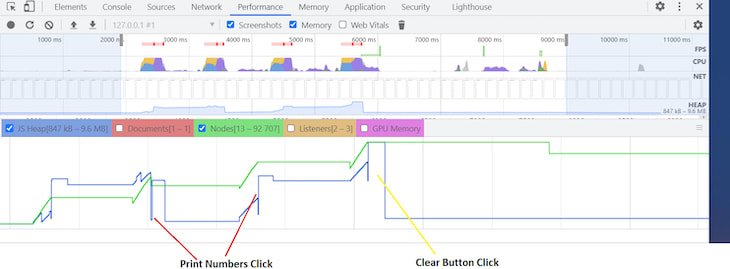
By analyzing the screenshot below, which is the performance timeline for the code snippet above, we can see that the JavaScript heap colored in blue spiked for every Print button click. These spikes are natural because JavaScript is creating the DOM nodes and appending characters to the global array.
The JavaScript heap gradually increased for every Print button click and became normal after the Clear button click. In a real-word scenario, you can consider there is a memory leak if you observe a continuous spike in memory, and if there is no decrease in memory consumption.
On the other hand, we can observe the continuous increase in the number of nodes, shown by the green graph since we didn't remove them:
Identify detached DOM nodes
As we discussed earlier, a node is said to be detached when it is removed from the DOM tree, but some JavaScript code still references it.
Let’s inspect the detached DOM nodes with the code snippet below. With the click of a button, we can append list elements to its parent and assign the parent to a global variable. In simple terms, the global variable is holding the DOM references:
var detachedElement;
function createList(){
    let ul = document.createElement("ul");
    for(let i=0; i<5; i++){
        ul.appendChild(document.createElement("li"));
    }
    detachedElement = ul;
}
document.getElementById("createList").addEventListener("click", createList);
We can use heap snapshot to detect detached DOM nodes. Navigate to Chrome DevTools → Memory → Heap Snapshot → Take Snapshot:

Once the button is clicked, take the snapshot. You can find detached DOM nodes by filtering Detached in the summary section, like below:
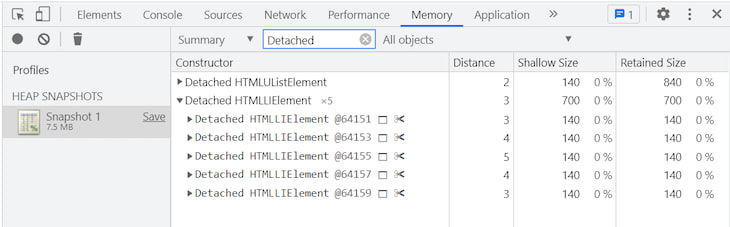
We explored Out of DOM nodes using Chrome DevTools. You can try to identify other memory leaks using this method.
Conclusion
In this tutorial, we learned about memory leaks, preventing them, and hunting memory leaks using Chrome DevTools.
Memory leaks are often caused due to flaws in your logic. Avoiding all the possible leaks can significantly improve your application's performance and save memory. I hope you enjoyed this tutorial, and happy coding!
LogRocket: Debug JavaScript errors more easily by understanding the context
Debugging code is always a tedious task. But the more you understand your errors the easier it is to fix them.
LogRocket allows you to understand these errors in new and unique ways. Our frontend monitoring solution tracks user engagement with your JavaScript frontends to give you the ability to find out exactly what the user did that led to an error.

LogRocket records console logs, page load times, stacktraces, slow network requests/responses with headers + bodies, browser metadata, and custom logs. Understanding the impact of your JavaScript code will never be easier!

Top comments (0)