Azure Monitoring Overview
The applications deployed on Azure are built on top of an architecture that is siloed and extremely dynamic. It is inevitable to monitor the applications and services to maximize the availability, performance, reliability and consumption.
Traditionally, Microsoft has always excelled in providing enterprise-grade platform services to run highly scalable and reliable applications. In monitoring and management standpoint, they don’t have great stories to flag. Monitoring an Azure environment using the first-party tools can be a challenging task for even the most skilled and expert team because of its complex and overlap offerings. In certain cases, there is more than one tool that does the same thing as others.
If you have tried to set up monitoring in the Azure portal, you might have faced a situation where one tool-A would require monitoring a resource-R, but if you want to do another monitoring activity on the same resource-R, then you would need to use tool-B. This might certainly lead a user to frustration.
Quick Start
Microsoft Azure provides a robust alerting and monitoring solution: Azure Monitor. Azure Monitor maximizes the supply and performance of your applications and services by delivering an inclusive solution for collecting, analyzing, and working on telemetry from the user’s cloud and on-premise environments.
What is Azure Monitor?
Azure Monitor is a powerful reporting and analytics tool. It maximizes the availability and performance of your applications by delivering a comprehensive solution for collecting, analyzing, and acting on telemetry from your cloud and on-premises environments. It helps you understand how your applications are performing and proactively identifies issues affecting them and the resources they depend on. Use it for insights into the behavior and running of your environment and applications. You can then respond proactively to the faults in your system.
How does Azure Monitor work?
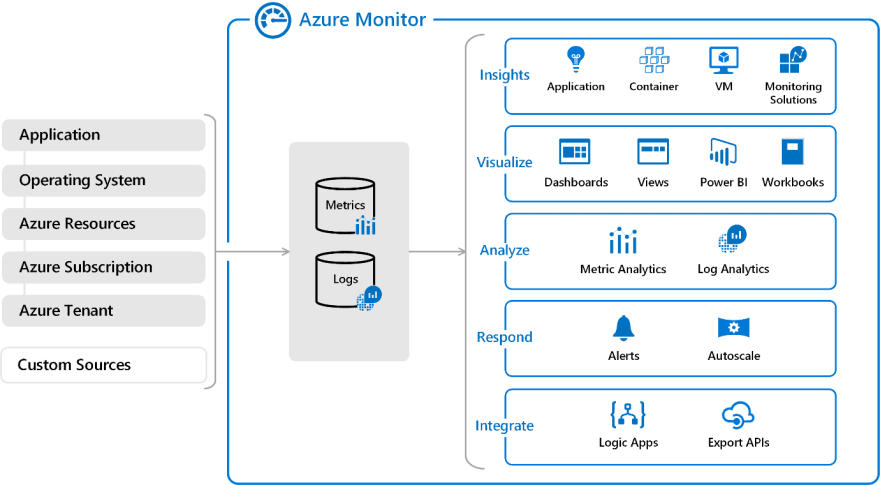
Azure Monitor receives data from target resources like applications, operating systems, Azure resources, Azure subscriptions, and Azure tenants. The nature of the resource defines which data types are available. A data type will be a metric, a log, or both a metric and a log. These data can further be processed to perform different functions such as analysis, visualization, alerting, automation and integrations.
- The focus for metric-based data types is the numerical time-sensitive values that represent some aspect of the target resource.
- The focus for log-based data types is the querying of content data held in structured, record-based log files that are relevant to the target resource.
Metrics
Metrics are measures of a resource’s certain characteristics over a given period. For instance, CPU utilization, disk IOPS, number of connections, etc. These are typically real-time, and since they are stored as values with a standard collection interval, they are ideally suitable for viewing as graphs to help you view results over time.
Metrics are numerical values that describe some aspect of a system at a point in time. Azure Monitor can capture metrics in near real-time. The metrics are collected at regular intervals and are useful for alerting because of their frequent sampling. You can use a variety of algorithms to compare a metric to other metrics and observe trends over time.
Metrics are stored in a time-series database. This data store is most effective for analyzing time-stamped data. Metrics are suited for alerting and fast detection of issues. They can tell you about system performance. If needed, you can combine them with logs to identify the root cause of issues.
Logs
Logs contain time-stamped information about changes made to resources. The type of information recorded varies by log source. The log data is organized into records, with different sets of properties for each type of record. The logs can include numeric values such as Azure Monitor metrics, but most include text data rather than numeric values.
The most common type of log entry records an event. Events can occur sporadically rather than at fixed intervals or according to a schedule. Events are created by applications and services, which provide the context for the events. You can store metrics data in logs to combine them with other monitoring data for analysis.
Data is logged from Azure Monitor in a Log Analytics workspace. Azure provides an analysis engine and a rich query language. The logs show the context of any problems and are useful for identifying root causes. The data from logs can be obtained using their native query language, “Kusto Query Language” or KQL. Users can then use these queries to create useful visualizations which can be pinned to dashboards.
What data types does Azure Monitor collect?
The following diagram gives a high-level view of Azure Monitor. On the left are the sources of monitoring data: Azure, operating systems, and custom sources. At the center of the diagram are the data stores for metrics and logs. On the right are the functions that Azure Monitor performs with this collected data, such as analysis, alerting, and streaming to external systems.
Data can be obtained from a range of sources through Azure Control. Users can opt for monitoring data at different levels across the application, any operating system, and resources it depends on, including the platform itself. For each of the following levels, Azure Monitor collects the data:
Application data: Data that relates to the custom application code. It is the data on the performance and functionality of the code that you have written, irrespective of its medium.
Operating System data: Data regarding the operating system in which the application is running i.e., data from the Windows or Linux virtual machines that host your application. It could be run on Azure, another cloud, or on-premises.
Azure resource data: Data that relates to the operations of an Azure resource, such as a web app or a load balancer.
Azure subscription monitoring data: Data that relates to the subscription and it also includes data about Azure health and availability.
Azure tenant monitoring data: Data on the Azure organization-level services, such as Azure Active Directory.
Since Azure Monitor is an automatic system, it begins to collect data from these sources as soon as you create Azure resources such as virtual machines and web apps. You can extend the data that Azure Monitor collects by:
- Enabling diagnostics: For some resources, such as Azure SQL Database, you receive full information about a resource only after enabling diagnostic logging for it. You can use the Azure portal, the Azure CLI, or PowerShell to enable diagnostics.
- Adding an agent: For virtual machines, you can install the Log Analytics agent and configure it to send data to a Log Analytics workspace. This agent increases the amount of information that’s sent to Azure Monitor.
How does Microsoft positions Azure Monitor?
As a newbie, it is good to know that Azure Monitor is the central plane for all monitoring toolsets and it is recommended to get into the habit of starting with Azure Monitor, even if you want to look at metrics, or Application Insights, etc.
At the outset, Microsoft is planning to make Azure monitor as the centralized starting point, for all Azure monitoring toolsets. Evidently, some of the other monitoring toolsets are being merged/rolled into Azure Monitor as a whole!
Azure Monitor – Key Requirements
Cloud systems are heavily distributed, meaning that there are many channels producing data at any given moment. Not just that, these systems are incredibly volatile, meaning, for example, if the resources are containerized, you need to think of a way to counter the dynamic complexity of containers in order to be able to continue with data. In addition to this, even a small to medium-sized Azure environment produces a vast volume of data and the scenario gets even more complicated.
The solution that Azure users rely on for monitoring and troubleshooting the applications to solve these problems must provide them with the following simple capabilities:
Data aggregation- Users need to be able to view and incorporate all data sources seamlessly through their Azure environment, capture the data generated, be it logs or measurements, and store this information in a centralized data store.
Data ingestion- Data pipelines are responsible for processing vast volumes of data which may experience a considerable amount of pressure in certain situations, resulting in the failure of components. Data shippers must be built to be resilient enough to accommodate huge and fluctuating amounts of data, as well as the storage backend services, they ship the data to.
Data storage- Data obtained from multiple Azure data sources must be stored in a consolidated data store capable of supplying the requisite scale to support data growth and data bursts. When diagnosing a production problem, the last thing you want to face is a failing data store because you have surpassed capacity.
Data processing- If you can’t process the data stored, it would be more difficult to interpret it. An Azure monitoring solution, for instance, needs to be able to process fields containing IPs and boost them with geographical information. It is easier to query data and visualize it if data is correctly parsed and analyzed.
Data analysis- End-users must be able to interpret Azure monitoring data efficiently. The ability to search or query the data is a fundamental prerequisite. With visualizations and dashboards, being able to examine the data from different perspectives is another key requirement. Ideally, in order to have hassle-free processing, users should be able to use advanced analysis capabilities, like anomaly detection and machine learning.
Alerting- In order to be aware of problems with the Azure environment, the user must be able to trigger alerts that will update them in real-time. This makes it easier for consumers to be more informed and to be on top of incidents as they arise.
Concepts
What can you monitor?
With Azure Monitor in hand, the Azure user can get the following services monitored,
Insights and Core Solutions
Insights and core solutions are viewed as part of the Azure Monitor and meet Azure’s support and service level agreements.
Insights: Insights provide a personalized monitoring experience for specific applications and services. They gather all logs and metrics and analyze them.
Core solutions: Solutions are based on log queries and views that are personalized to a given application or service. They just compile and review logs and are deprecated in favor of insights over time.
Azure Services
Azure Services are the resources offered by Microsoft Azure such as Azure Active Directory, Logic Apps, Service Bus queues and Topics, Event Hubs, Event Grids, Function Apps, etc. Below are the data or parameters which are enabled for the Azure services for monitoring.
- Metrics: The service automatically gathers metrics into the Azure Monitor Metrics.
- Logs: The service supports diagnostic settings gather platform logs and metrics into Azure Monitor Logs.
- Insight: An insight is available for services with a personalized monitoring experience.
Virtual Machine Agents
The virtual machine agent receives data from the virtual machine’s guest operating system and sends data to the monitor. Different data can be gathered by each agent and submitted to either Metrics or Logs.
Product Integrations
The product/service saves the data in Log Analytics workspace so that it can be analyzed alongside other log data obtained by Azure Monitor.
Other Solutions
For the monitoring of various applications and services, other solutions are available, but successful implementation has stopped and may not be available in all regions. The Azure Log Analytics data ingestion service level arrangement covers them.
Continuous monitoring
Continuous monitoring relates to the mechanism and technologies required to implement monitoring across each point of your DevOps and IT operations. When it goes from implementation to production, it helps to constantly maintain the health, efficiency, and functionality of your application and infrastructure. Continuous monitoring draws on Continuous Integration and Continuous Deployment (CI / CD) principles that enable you to design and execute applications more efficiently and consistently to provide your customers with continuous value.
Azure Monitor is Azure’s centralized management solution, offering full-stack observability across cloud and on-site software and networks.
Data Platform
Azure Monitor gathers and aggregates data into a shared data platform from a number of sources where it can be used for analysis, visualization, and alerting. It offers a seamless experience on top of multi-source data, giving you in-depth views into all your tracked resources and even data from other services store their data in Azure Monitor.
The three foundations of observability are generally called metrics, logs, and distributed traces. These are the various forms of data that must be collected and analyzed by a monitoring tool to provide adequate observability of a monitored system.
Data Sources
There are different sources of monitoring data collected by Azure Monitor in addition to the monitoring data created by Azure resources, they are
- Application Tiers
- Azure Tenant
- Azure Subscription
- Azure subscription
- Azure resources
- Operating system (guest)
- Application Code
- Monitoring Solutions and Insights
- Custom sources
- Other services
Alerts
In Azure Monitor, alerts proactively notify you when issues are detected with your infrastructure or application using your monitoring data. Before the users of your system notice them, they allow you to identify and address issues. Alert rules are detached from alerts and the actions taken when an alert fire. The alert rule manages to capture the alert target and the alert criteria. It is possible to have the alert rule in an enabled or disabled state. Alerts fire only when enabled.
Metric Alerts
Metric alerts are used to achieve regular threshold monitoring of Azure resources. Azure Monitor runs metric alert trigger conditions at regular intervals. When the evaluation is true, Azure Monitor sends a notification. Metric alerts are stateful, and Azure Monitor will send a notification only when the prerequisite conditions are met. Metric alerts can be useful if, for instance, you need to know when your server CPU utilization is reaching a critical threshold of 90%. You can be alerted when your database storage is getting too low, or when network latency is about to reach unacceptable levels.
Log Alerts
Log alerts use log data to assess the rule logic and, if necessary, trigger an alert. This data can come from any Azure resource: server logs, application server logs, or application logs. By its nature, log data is historical thus usage is focused on analytics and trends. These types of logs can be used to assess if any of your servers have exceeded their CPU utilization by a given threshold during the last 30 minutes. Or, you can evaluate response codes issued on your web application server in the last hour.
Activity Log Alerts
Activity log alerts enable you to be notified when a specific event happens on some Azure resource. For example, you can be notified when someone creates a new VM in a subscription. An activity log can also include alerts for Azure service health. Activity log alerts are designed to work with Azure resources. Typically, you create this type of log to receive notifications when specific changes occur on a resource within your Azure subscription.
Choose monitoring solution for cloud-native Integration solution
Azure Monitoring Tools play a critical role in all forums right from a small company to a large enterprise. It is one of the prioritized metrics because it is essential to keep an eye on various components integrated into a business application to understand if they are functioning as expected. On the other hand, it is also valuable in understanding the errors at the right time and rectifying them so that an organization incorporates healthy functioning.
Native Azure Monitoring tools
Azure itself offers hands-on native monitoring tools to ensure that you built your Azure integration and get it monitored under the same roof. Listed below are the native monitoring tools offered by Azure,
Activity Logs
The Azure Activity Log is a Subscription log that gives knowledge into Subscription level events that have been created in Azure. It incorporates a scope of information, from Azure Resource Manager operational information to refreshes on Service Health events. You might need to Archive the Azure Activity Log in case you retain your Activity Log longer than 90 days for governance, investigation and backups.
Log Analytics
Azure Log Analytics Workspace is the logical storage unit where log data is collected and stored. It can be considered as the primary management unit of Azure Monitor Logs. It is used to collect data from various sources such as Azure Virtual Machines, Windows or Linux Virtual Machines, Azure Resources in a subscription, etc. It facilitates an assured monitoring service to fulfil the monitoring needs of the user.
Azure Alerts
Alert is a monitoring service offered by Azure Monitor that proactively notifies the user when issues are found with your infrastructure or application using your monitoring data in Azure Monitor. There are three types of Azure Alerts available:
- Metric Alerts: These alerts will monitor the Azure resources based on Metrics that are specific to Azure resources and alerts the user whenever there is a Violation with the configured threshold value. E.g., Count of Dead-Letter messages metric for Service bus, Run Succeeded for Azure Logic Apps.
- Log Alerts: These alerts allow users to monitor the Log Analytics queries by evaluating resource logs every set frequency, and trigger a notification based on the values returned from the query.
- Activity Log Alerts: Activity log alerts will send an alert report whenever there is a new activity log event occurs that matches the specified condition.
Azure Diagnostics
Azure Diagnostics offers capabilities to export to metrics and activity to logs to other resources for Custom monitoring and manipulation. These diagnostic logs can be passed to resources like Azure Storage, Log Analytics workspace, and Event hubs for further processing.
Azure Metrics
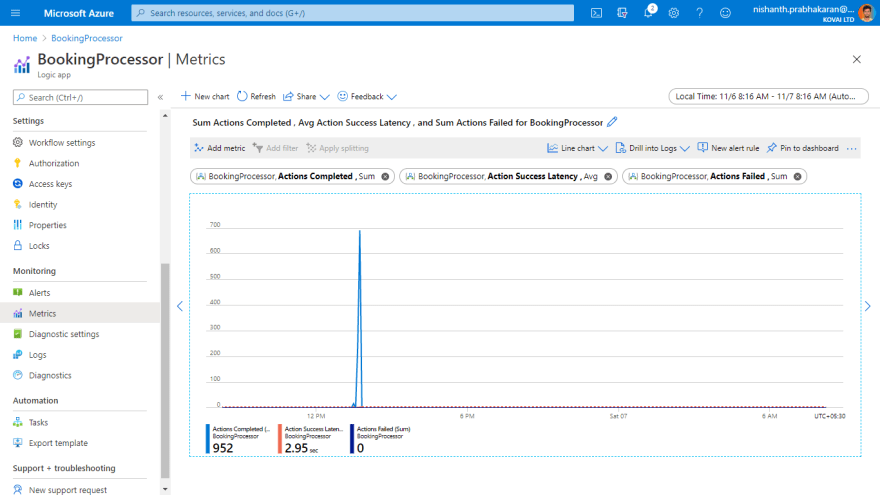
Metrics are numerical values that describe some aspect of a system at a particular time. Metrics are collected at regular intervals that can be used for analysis, visualization, and monitoring. Every Azure resource offers an extensive set of metrics specific to that resources which can be used to create charts and alerts.
Service Health
Azure Service Health keeps you informed on any planned downtime. Due to maintenance some resources and regions may have some impact, and this will be intimated to the users in advance so that they can act accordingly.
Azure service health contains three Events that help you understand better some unexpected errors and planned downtimes.
- Service Issues – Contains reports of the current issues happening in Azure like service outages, etc. and even the solution from the Azure development team can also be found here
- Planned maintenance – Contains reports of planned maintenance service scheduled by Azure and even reports of some solution on how you could achieve less impact on this downtime
- Health advisories – reports issues that require your action to avoid service interruption
Azure Advisor
Azure Advisor is a personalized cloud advisor that helps you follow best practices and tips to optimize your Azure deployments. It analyses the resource configurations and usage telemetry and recommends the best possible solutions that can help you improve the cost-effectiveness, performance, reliability, and security of your Azure resources.
Azure Application Insights
Application Insights are used to monitor live applications and to Detect and Analyse issues in the applications. It can do anomaly detections and designed to improve performance and usability.
Third-Party Azure Monitoring Tools
With the native monitoring tools offered by Azure, it is not possible to get customized monitoring or application-level consolidated monitoring. To address such issues, we have some brilliant third-party Azure monitoring tools in the market to complement the loopholes in Azure Monitor.
Serverless360
Though the scope of Serverless360 is way more than monitoring, it helps you to keep a check on the health, availability, performance, and operational metrics. Once, you determined where the actual error happened using its built-in monitors, it helps you to solve the problem. For Instance, Reprocessing of dead-lettered messages to a Queue or Topic once it piled up in the queue.
Dynatrace
Dynatrace brings infrastructure and cloud, application performance, and digital experience monitoring into an all-in-one, automated solution that’s powered by artificial intelligence. Dynatrace will be mainly useful for developers to perform Application, Infrastructure, and Cloud monitoring.
AppDynamics
AppDynamics provides an end to end visibility into the performance of your application. They provide end-user monitoring, infrastructure visibility, application performance monitoring, and business performance monitoring.
Datadog
Datadog is a monitoring service for multi cloud-scale applications, providing monitoring of servers, databases, tools, and services, through a SaaS-based data analytics platform.
NewRelic
New Relic Infrastructure can be used to monitor your Azure services based on the user query. New Relic offers monitoring services for Cloud applications, Servers, databases, containers, and Infrastructure and cloud monitoring.
Complementing Azure Monitor with Serverless360
It is important to determine the type of monitoring tool that is required for your Azure Application. Analyze if it is simple enough to know the performance of the application, is it meeting your SLA, is the experience for users as expected? or if you need to find the errors in your application at the right time and rectify it using a tool like Serverless360 which is significantly build to improve the efficiency of your operations and support team in resolving issues.
Monitoring Azure resources with Serverless360
Serverless360 is one platform for Azure Serverless monitoring and management. In a real-time scenario, the integrated cloud applications are not built with a single technology stack, it typically involves multiple Azure Services. Currently, Azure Portal is designed more on vertical technology silos and it’s difficult to visualize and manage such connected solutions. Serverless360 is one tool that you can depend on for Azure Serverless monitoring and management from one place. Serverless360 is crafted with capabilities to complement the Azure Portal.
Serverless360 is an extensive Toolset to manage and variety of monitors to offer Consolidated monitoring on Composite Applications which represent the business solution. Let’s get started with the different types of monitors,
Threshold Monitor
The threshold monitor will constantly examine the current state/ value of the selected metrics for any violations. If the violation persists for the specified duration of time, the configured number of alerts will be sent on the configured Notification Channels.
Being updated on the status of resources is always essential. But it will be even profitable for any business to make use of an auto-correct option available in Serverless360’s Threshold monitor. With the Threshold monitor being activated on the resources involved in your business, you can rest assured that your resources will always remain in an active state. The Threshold monitor helps you to be proactive than being reactive during the downtime of a resource.
Data Monitor
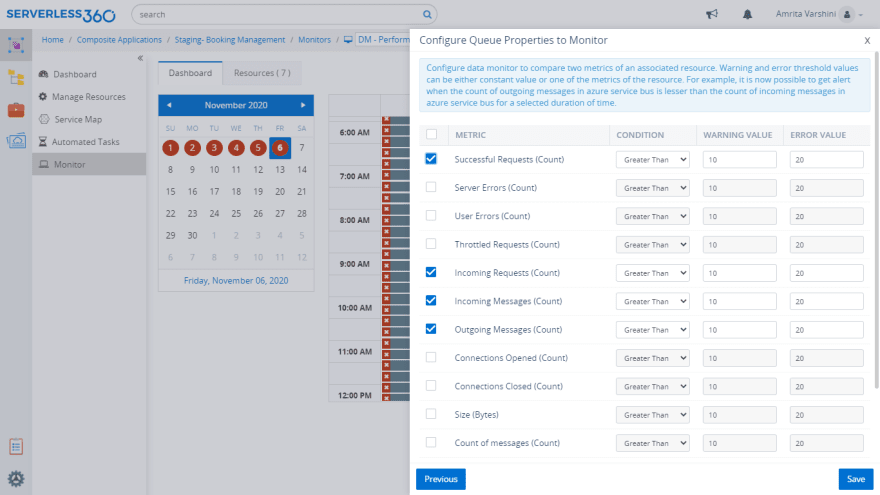
Data Monitoring is the concept of assessing historical data and generating alerts based on expected criteria. This is one of the unique monitoring capabilities of Serverless360, which adds so much value to our customers. Data Monitoring can facilitate monitoring the Azure resources like Service Bus Queues, Topics, Logic Apps, Function Apps, Event Grid Topics, and Event Subscriptions in various perspectives like availability, reliability, consumption, and efficiency.
With the help of the Data Monitor in Serverless360, the user can configure a warning threshold value for the metrics of the Resources which will send us an alert on breach of the configured threshold value. Similarly, when the Error Value is breached you will get notified. Servereless360’s data monitor does not stop there. With data monitor users can perform cross monitoring among various metrics.
Status Monitor
Knowing the status of your Azure resources is an important factor to ensure the smooth flow of business hosted on a cloud platform. The Status monitor helps users to better understand the health status of each resource at prescribed time intervals. The report generated in Serverless360 will be a consolidated monitoring report, where the application level of visibility is achieved.
The above is obtained by adding our Logic apps, Function apps, Service bus queues, and Topics into a single status monitor. This helps users to attain application-level monitoring.
Watch Monitor
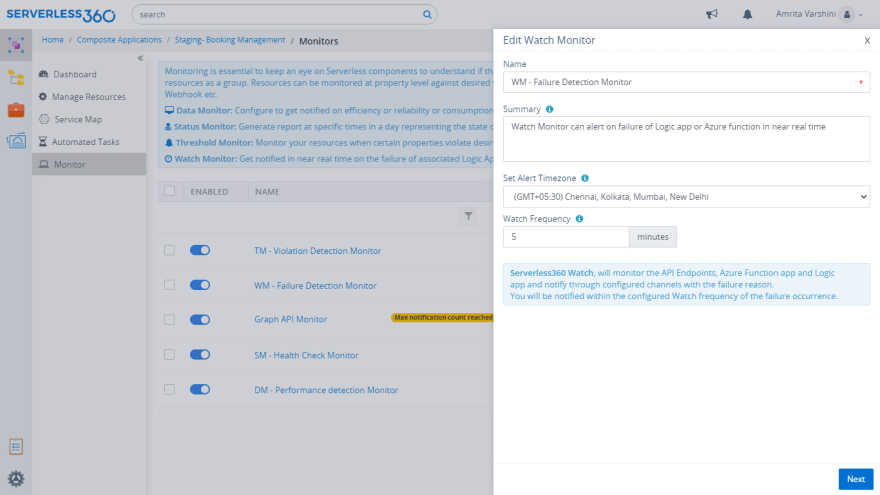
Watch monitor in Serverless360 can notify the failure of Logic Apps or Azure Functions in near real-time. The notification can be received on the configured notification channels. Watch monitor is designed to start monitoring with minimal configuration and provide a failure report, within 5 minutes of the failure, with the necessary information to take corrective action.
In the case of Azure architectures with fine usage of the Azure Logic App and Function App, the Status monitor and threshold monitor will alert us on the status of the resource. But there are chances that a logic app run may fail, or a function app execution may fail. During these failures, Serverless360’s Watch monitor can send an alert report within 5 minutes from the time of failure. The alert report sent will have the necessary information to take proactive actions. With Serverless360 watch monitoring in place, any failure in the orchestration due to an error in the execution of Logic App or Azure Function can be brought to the notice of the required team to take necessary action in near real-time.
Business Activity Monitor
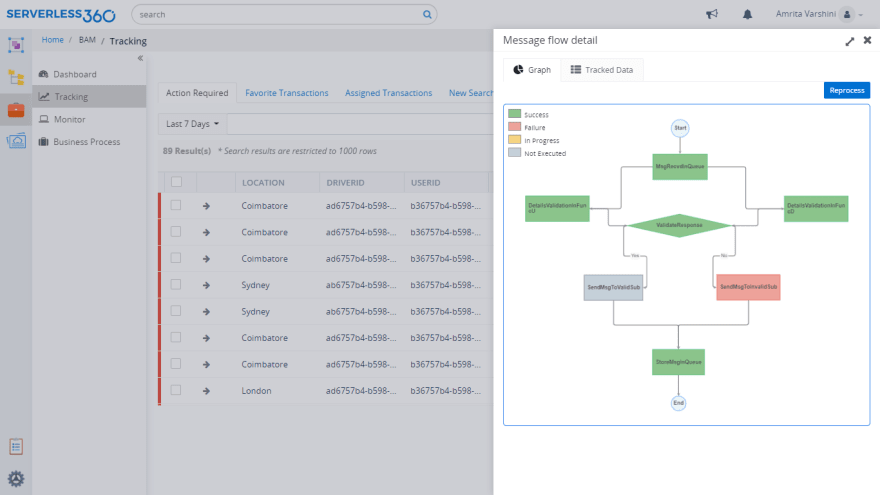
Business Activity Monitor is a functional end to end business activity tracking and monitoring product for Cloud Scenarios. With Serverless360 BAM, get full visibility of your end-to-end business process flow across your Azure resources.
Business Activity Monitoring (BAM) is a way to provide a simplified business-focused view on what might be a complex underlying system or group of system interactions that execute to fulfill the business transaction. If you have a BAM solution, then you can significantly simplify the ability to support these business transactions. You can make it easy for your support team to get to the issue quickly, you can recover from issues faster and you can even allow business users to have track on the status of your business.
End-to-End Tracking Solution
In any kind of integration solution, there is a need for the organization to build an end-to-end traceability/monitoring solution that can be used by the business users. Often this is an afterthought, and the operational support team struggles to run the solution that has been implemented. Sometimes the delivery team will work on a solution but often it is bespoke and difficult to use across projects and teams spend about 20-30% of their time addressing this challenge, building custom solutions like logging components, and web dashboards. Most of the time the solution will be premature, since building an enterprise-grade tracking/monitoring solution requires enormous effort.
With Serverless360’s end to end tracking bring maximum visibility of your integration solution to functional support teams by defining properties to track business values at run-time. Easily correlate the flow of data within your system.
Serverless360 is not just a metric based monitoring tool, it has got outbox management solutions to help achieve critical tasks at ease. Manage entity properties, define Topic subscription rules, import Service Bus, Event Hubs, and Relays from one namespace to another, manage shared access policies, process messages in Service Bus, Storage Queues, and Event Grid Subscriptions, and do much more. Serverless360 indeed stands out as one platform solution for Azure Serverless monitoring and management. Serverelss360 offers an enhanced version of Azure monitoring based on entity metrics along with many more monitoring solutions mentioned above in this article.
Documents and Webinars
Also, explore these documents and webinar sessions for deeper knowledge,
Six Features to Manage and Monitor Azure Resources
Azure Monitoring Tools for Cloud-Native Integration Solution
Centralized Monitoring in a Cloud-Native Integration
Azure Monitor and Serverless360 Comparison
Overview of Azure Health Monitoring
This Webinar covers in detail about the capabilities of Serverless360 which helps to monitor Azure resources and detect the failures that are not possible in the Azure portal.







Top comments (0)