
This is a submission for the KendoReact Free Components Challenge.
What I Built
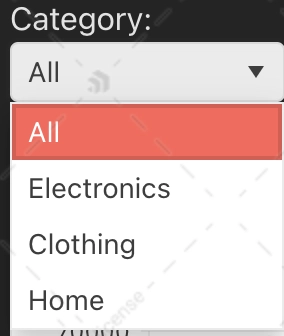
I created a Business Intelligence Dashboard using KendoReact to visualize sales performance and manage product inventory efficiently. The dashboard integrates interactive charts, a dynamic product grid, and filtering features to help businesses make data-driven decisions.
Demo
🎥 Check out the live demo: Live
📂 Explore the code on GitHub: Repo
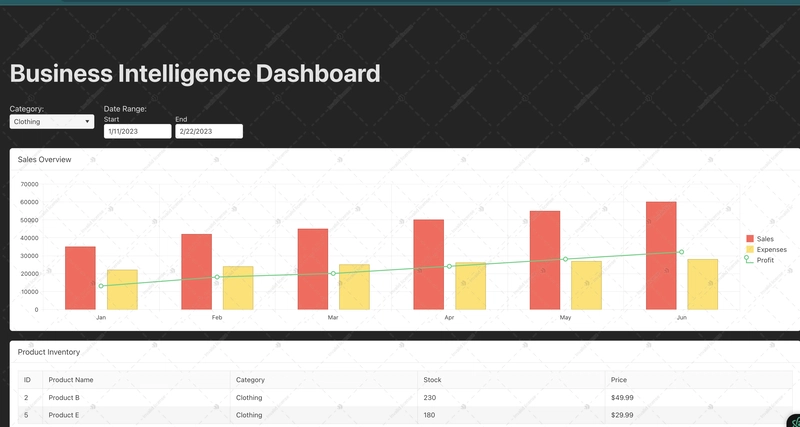
KendoReact Experience
KendoReact made building this dashboard incredibly smooth. I leveraged:
✔️ Charts for sales data visualization
✔️ Grids for product inventory management
✔️ Dropdowns & Date Pickers for seamless filtering
The components were easy to customize and integrated effortlessly with React state management.
AIm to Impress
I integrated AI-powered data insights to suggest optimal sales strategies based on past trends. This makes the dashboard not just a visualization tool but also a decision-making assistant!
Delightfully Designed
Using Kendo UI Figma Kits and Progress ThemeBuilder, I maintained a clean and modern UI. The predefined themes saved me hours of manual styling.


Top comments (0)