As development teams continue to adopt microservices and distributed systems, observability becomes increasingly important to managing services, troubleshooting issues, and keeping track of your production environment. With the rise of cloud computing, the cost of monitoring has never been lower; however, observability solutions tend to be costly and can be difficult to set up. Opensearch offers an open-source solution that promises to make observability easier than ever before. Here’s how it works.


What is observability?
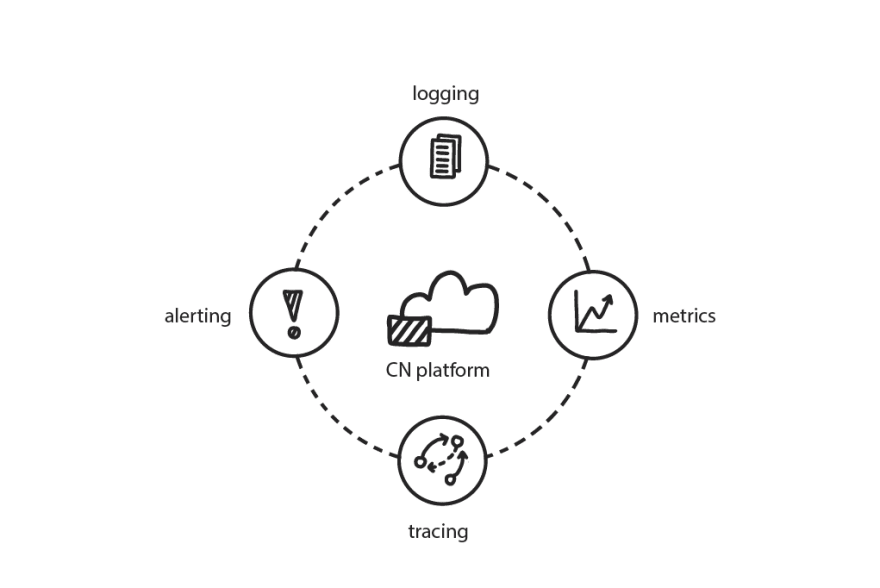
In a nutshell, observability is about how your application works from a technical perspective. It encompasses tools and techniques that allow you to gain visibility into your systems, allowing you to understand their behavior and identify abnormalities. On one hand, observability is a new term for something that’s been around for a long time. Logging has been around since logging was invented. After all, if it wasn’t useful there wouldn’t be much point in it! But as technology has evolved from batch-oriented monolithic applications on physical hardware towards distributed systems deployed as code on virtualized infrastructure, new challenges have emerged with regards to troubleshooting and debugging those systems.
Why opt for opensearch?
Opensearch is a completely open and vendor-neutral standard that provides you with full observability and management of your data. It also works with your existing SIEM and analytics tools, which makes it ideal for large organizations that need a quick way to ingest data from multiple sources. For developers, opensearch provides a standard interface for interacting with metadata about code dependencies without having to write code. That means less time writing code and more time building functionality. In other words, OpenSearch helps maximize developer productivity – making it an attractive prospect for any organization big or small.
Setting up opensearch
If you’re deploying a new application and want it to be observable, we recommend setting up Opensearch right away. Setting up Opensearch will allow you to ingest logs from your application using search filters. This is essential for understanding what’s happening with your application in real time so that you can react quickly when things go wrong. If you have a lot of different microservices running on multiple hosts, sending data from each host independently may not scale well. Sending logs from a single source means that all of your data is in one place and saves some headache later on when you want to begin searching through it. Logging services such as Beat agent, Logstash or Fluentd can also be used instead of Opensearch if needed.
The Jelastic certified template is created for every mentioned open-source stack (OpenSearch, OpenSearch Dashboards, Logstash). Certified images are used instead of custom ones to make all the Jelastic-specific functionality available for users (password reset, service restart, re-deploy, cloning, migration, log viewing, managing firewall). These 3 templates are united into the one auto-clustered solution by the auto-clustering JPS.

Ingest your data
You can ingest data into OpenSearch with many useful tools, including Logstash. Logstash is an application for managing events and logs. Although it was initially created by Elasticsearch, it now has support for other products, such as Apache Kafka and Amazon Kinesis. It ingests data from nearly any source using a variety of methods, including TCP/UDP sockets and file system hooks (e.g., S3 or FTP). Once your data is in Logstash, you can run simple or complex queries on that data for better visibility into problems or trends in your application environment. Look for yourself the list of available agents: https://opensearch.org/docs/latest/clients/agents-and-ingestion-tools/index/
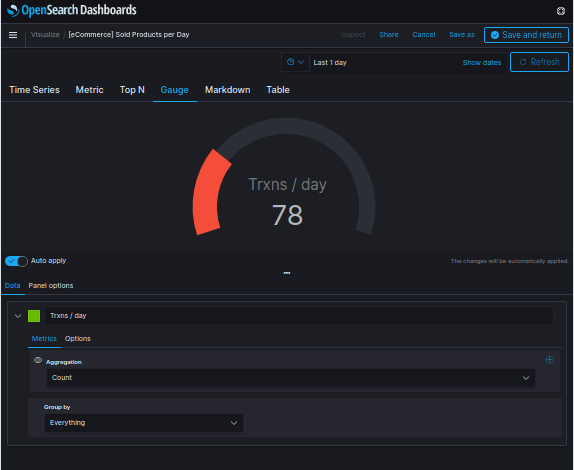
Create your first dashboard
Create your first real-time dashboard by ingesting data from Opensearch. Follow these basic steps in order to get a real-time feed of your data in a matter of minutes. Begin by logging into your OpenSearch account and selecting a collection in which you’d like to view metrics. Next, add a search to a new or existing app in which you have an interest, such as Kubernetes. In Kubernetes, add labels for each key metric that is being collected, such as CPU usage and memory utilization.

Add alerting capability
We saw that you can easily add alerting to Opensearch, allowing Ops teams to create notifications based on specific events. For example, if an application fails to start, an alert can be generated and sent out via email or Slack. But while Opensearch comes with a range of simple rules for finding failed instances quickly, users may want something more powerful than alerts. With our Auto-Scale feature, you can configure Opensearch so that if an instance fails multiple times in a specified period of time (e.g., three failures in 15 minutes), it is automatically scaled down! This keeps your application running efficiently while reducing your costs.

Deploy Opensearch with our Jelastic PaaS template
We’ve developed a Jelastic PaaS template that enables you to get up and running quickly. Within minutes, you can have your own fully functional Opensearch instance deployed. Check out our guide for more information about deploying Opensearch with Jelastic.

Top comments (0)