Photo by Milestoned on flicker.com.
Introduction
During an application-monitoring workshop, I was introduced to the distributed tracing. I was immediately interested in that and I understood the potentiality that this method can offer to monitor a distributed system in production.
So, I started to learn about Jaeger¹, OpenTracing², traces, spans, tags, …
Then I instrumented my first APIs using HTTP headers for the transport layer and everything was fine. I was able to see the tracing in action!
But then I wondered: how can I instrument services that don’t expose APIs and that don’t speak each other through HTTP? I’m speaking about services that are part of the same pipeline, that work on the same data in an event-driven architecture or that use direct requests to communicate, but in which I can’t use an HTTP header to propagate down the context information.
Distributed tracing: a very brief description
Distributed tracing, is a method used to profile and monitor applications, especially those built using a microservices architecture. Distributed tracing helps pinpoint where failures occur and what causes poor performance.³
That means you can easily understand and monitor your services in production in a visual way. Tracing adds observability.
Thanks to that, the troubleshooting teams can analyze issues and debug a system in all its parts. It simplifies and reduces the time for the root cause discovery. In addition, it can be useful to the developers to better understand how to develop a new feature or introduce an improvement in the system.
Since the scope of this article is not an introduction about distributed tracing I don’t deepen into this. To understand better what tracing is, I posted below some useful articles.
Redis as a message queue
Referring to my previous evaluation, in case you can’t propagate the information context through HTTP Headers, you can use a message queue.
So, I created the example application Distributed Tracing with Redis⁴ in which I simulated a pipeline composed of 3 different apps: one main service and two different workers that work on the same data.
In this example, the main service starts the two workers by executing a shell command. The main service passes a parameter — that contains the job id — to the apps.
The application’s transaction cycle
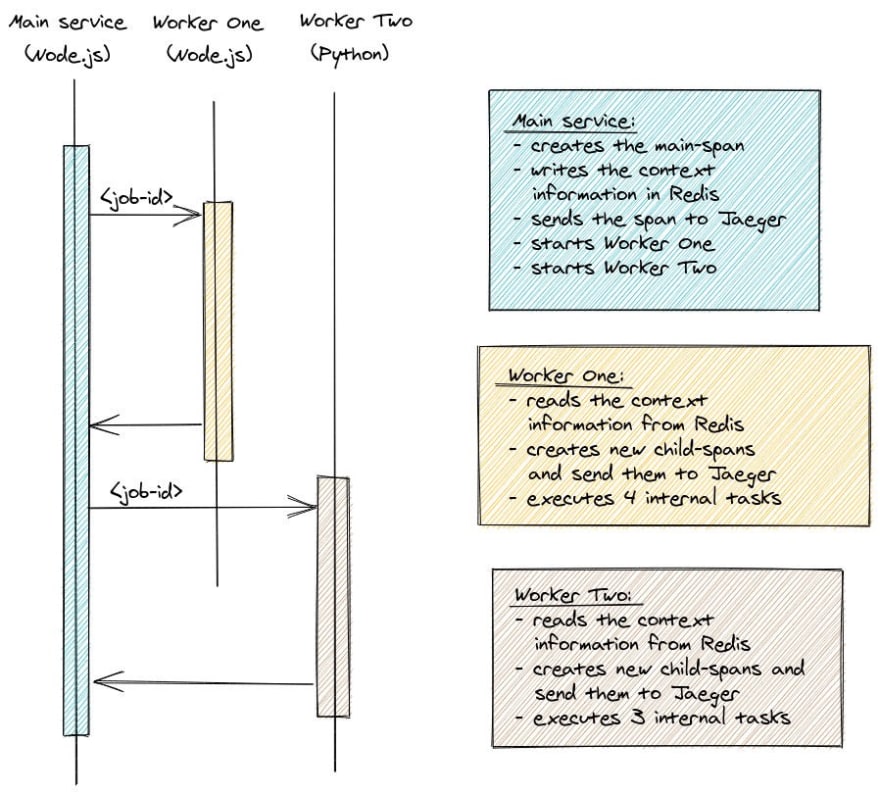
In the application, the main service starts a new tracing span and then propagates the span context saving it in Redis, our message queue. The context is saved using the job id as the key. Then it starts the execution of the two workers, just providing the job id.
When the two workers start, it is their responsibility to retrieve the context from Redis, create a new span, and establish a relationship with the main span.
The two workers are executed in a sequential way, so only when the first worker is completed, the second will start. All the apps simulate the execution of internal tasks, sending some tracing spans, tags, logs to the Jeager Agent.
The following image can be useful to describe better what these apps do.
The architecture
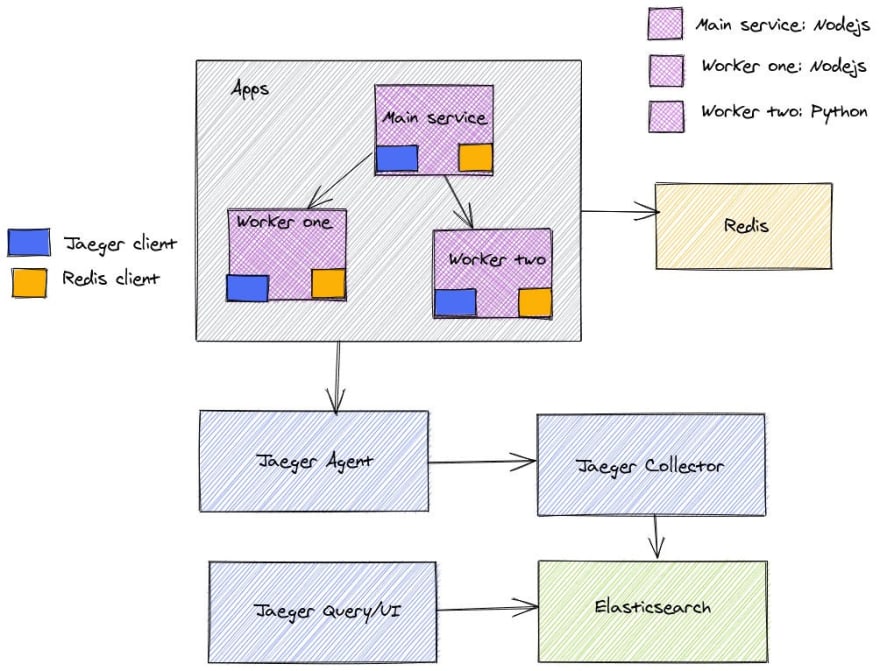
The application’s architecture is mainly composed of:
Apps module
Redis, to propagate the span context
the Jaeger stack: Agent, Collector, Query/UI
Elasticsearch, to save the traces
The image below shows the tracing architecture.
Let’s jump into the code!
I instrumented the components using OpenTracing. So, I added in each of them the code to send the spans to the Jaeger Agent. In order to do that, I used the Jaeger clients and the OpenTracing libraries for NodeJS and Python.
In the following sections, I briefly described how I instrumented the code to propagate the context.
The main service
In the following snippets of code, the main service creates the new main span, saves the context information, and then starts up the two workers providing the job id.
As shown in the code, the context span is saved in Redis using a key-value pair, providing the job id as the key. The value is instead filled with the context span in the TEXT_MAP format provided by OpenTracing.
The worker apps
Here below you can find the snippet of code developed for the two apps to read the span context from Redis.
When the worker apps start, the job id is provided as an input parameter. The worker creates a continuation span that will be attached to the main span before being extracted from Redis using the job id key.
Then some tasks are executed internally by the worker.
During the execution of the internal tasks, new child spans are created. All of them are created establishing a follows from reference to the propagated parent span context. All the child spans will be displayed in the same trace, as children of the main process span.
A very similar Python version of the code is displayed below for the second worker.
Visualizing traces
If you deploy and start all the components and you open a browser on http://localhost:16686/, you will be able to see all the traces sent by the three apps through the Jaeger UI.
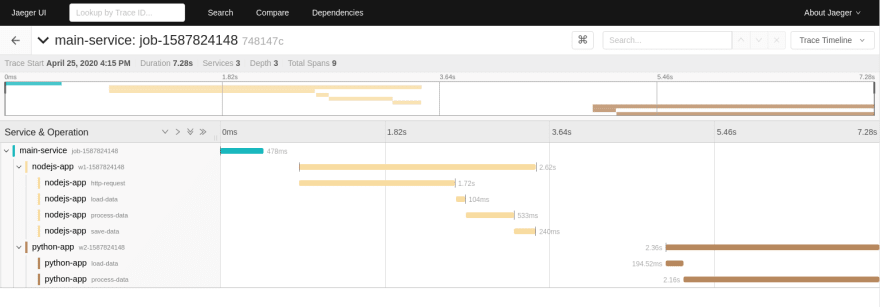
If you select a trace, you can see the details and the time spent from each component, also when they execute their internal tasks.
In the example below, we can see:
the main span created by the main service (in blue)
the spans created around the tasks executed by the first worker (in yellow)
the spans created and attached by the second worker (in brown)
All the spans are part of the same trace.
Conclusion
In the article, I presented a possible solution to instrument apps for distributed tracing when you have a system in which the services are triggered using direct requests, but not through Rest APIs. So, HTTP headers are not available to propagate the context and you don’t want to introduce them in your system.
The aim can be reached by instrumenting the apps using Jeager, OpenTracing, and adding a message queue in the architecture for the transportation layer.
The presented solution can be also modified and used in an event-driven architecture, in which the services are using a message queue to share the process information. You can simply add the context spans information to the messages in the queue.
References
Some very useful Medium articles that helped me:

Redis-tributed: distributed tracing through Redis - Alex Boten - Medium
Alex Boten ・ ・ 5 min read
 Medium

Weave trimmed troubleshooting fat, cut API response time from seconds to milliseconds with Jaeger
Orate ・ ・ 8 min read
 Medium
Footnotes
[1] Jaeger: an open-source software for tracing transactions between distributed services.
[2] OpenTracing: a specification and standard way that helps developers to easily instrument their code base for distributed tracing.
[3] What is tracing: https://opentracing.io/docs/overview/what-is-tracing/
[4] GitHub project: https://github.com/mattiacapitanio/distributed-tracing-with-redis


Top comments (0)