
The goal of this post is to load CSV (Comma Separated Values) file into Logstash which will process the data and give it to Elasticsearch for data storage and use Kibana to query and visualize the data. To achieve this, the process is shown in the image below:

Note: This article assumes that the reader has no prior knowledge of Elasticsearch, Logstash, Kibana and I will try to explain the basics to get it up and running. This post is not for advance working of Elasticsearch, Logstash, Kibana.
So let's get started
For those of you who are unaware of the Elasticsearch, Logstash, Kibana below is a quick intro of all three. When used together it is also known as the ELK stack.
Elasticsearch:

Logstash:
Kibana:

You can read more about it from here
Now having the understanding of the ELK stack lets dive in. First, you will need to download Elasticsearch, Logstash, Kibana
Note that the downloads will be in compressed folder. Extract all three (Elasticsearch, Logstash, Kibana) folders in your system.
Open Command Prompt in Windows or Terminal in Mac, go to the path where the folders are extracted.
(For this tutorial I'm using Windows operating system and I have extracted the folders in "D:\2020\Logstash\". At the time of this post the latest version for all three (Elasticsearch, Logstash, Kibana) is 7.7.1)
To run elasticsearch. Go to the bin folder of elasticsearch and then type elasticsearch, as shown below:
cd D:\2020\Logstash\elasticsearch-7.7.1-windows-x86_64\elasticsearch-7.7.1\bin
D:\2020\Logstash\elasticsearch-7.7.1-windows-x86_64\elasticsearch-7.7.1\bin>elasticsearch

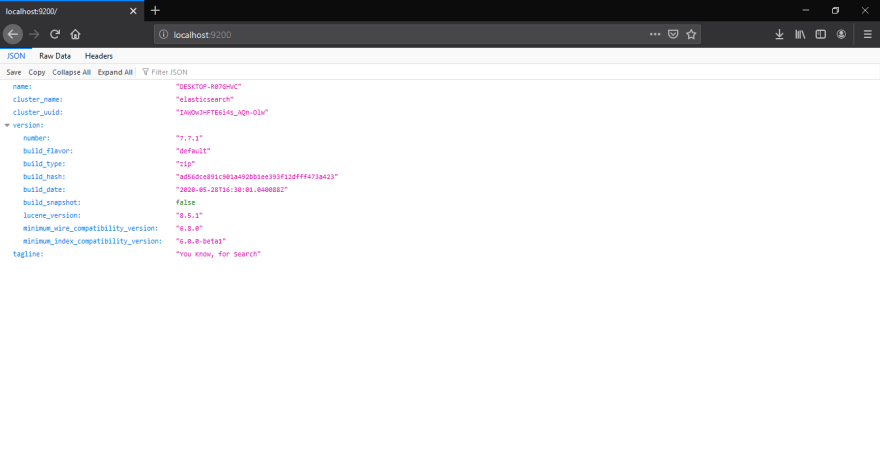
By default elasticsearch runs on port 9200 of localhost. Once the elasticsearch is loaded and running, as shown in below screenshot.

You can now hit the http://localhost:9200 in your browser to check elasticsearch details. The URL returns a JSON file with details like name, cluster_name, cluster_uuid and version details.
To run kibana. Go to the bin folder of kibana and then type kibana, as shown below:
cd D:\2020\Logstash\kibana-7.7.1-windows-x86_64\kibana-7.7.1-windows-x86_64\bin
D:\2020\Logstash\kibana-7.7.1-windows-x86_64\kibana-7.7.1-windows-x86_64\bin>kibana

By default kibana runs on port 5601 of localhost. Once the kibana is loaded and running, as shown in below screenshot.

You can now hit the http://localhost:5601/app/kibana#/home in your browser to check kibana details. The URL returns the homepage of kibana.

Next, to run logstash, we need to supply a config file as a parameter. So we'll need to create the config file.
Structure of a Config File
A Logstash config file has a separate section for each type of plugin you want to add to the event processing pipeline. For example:
# This is a comment. You should use comments to describe
# parts of your configuration.
input {
  ...
}

filter {
  ...
}

output {
  ...
}
Each section specifies the configuration options for one or more plugins. If you specify multiple filters, they are applied in the order of their appearance in the configuration file.
You can read more about it from here
Click here for more configuration examples
For CSV file, you can create a CSV file or download it from Kaggle.com. In this post I've taken a sample file from movies-on-netflix-prime-video-hulu-and-disney.
Note that these files may contain billions of data/ records which makes a perfect example to use it in elasticsearch.

Example of the CSV file which I've used for this example:
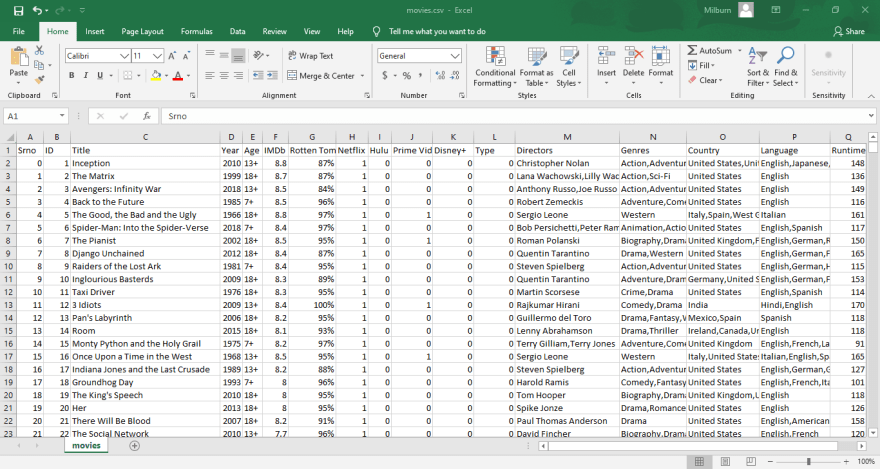
I've created a new folder named data and pasted the csv file in it. The name of the CSV file is movies.csv. Then create a new file with .config extension. I have named it logstash_movies.config. Note that these files need not be under the same folder and can have different names as well, as we will be specifying their paths with their file name, but for convenience I will put them under the same folder. Paste the below content in the config file
input {
    file {
        path => "D:/2020/Logstash/data/movies.csv"
        start_position => "beginning"
        sincedb_path => "NUL"
    }
}

filter {
    csv {
        separator => ","
        columns => ["Srno","ID","Title","Year","Age","IMDb","Rotten Tomatoes","Netflix",
        "Hulu","Prime Video","Disney+","Type","Directors","Genres","Country","Language",
        "Runtime"]
    }
    mutate { convert => ["Year", "integer"]}
    mutate { convert => ["IMDb", "float"]}
    mutate { convert => ["Runtime", "integer"]}
}

output {
    elasticsearch {
        hosts => "localhost"
        index => "movies"
        document_type => "streaming_movies"
    }
    stdout {}
}
The input section configures the path to the CSV file, start_position specifies where to begin reading the data example from beginning or end of file (by default if you don't set, it is set to end of file), sincedb_path specifies the path to store the data, set to null if data storing is not required, etc.
The filter section configures the csv and mutate filters. The csv section specifies the separator, columns, etc. By default all columns are set datatype as string but you can mutate it by converting it to the specified datatype like integer, float etc.
The output section configures elasticsearch which specifies
host - set to localhost or the actual I.P address where the ELS stack is hosted,
index - it is the index parameter used to identify the records for the given data. All data is fetched/ retrieved using this index parameter. We'll discuss more about index parameter later of this post,
document_type - each record is a document.
Note that if you are using Mac O.S, change the following line:
Windows: sincedb_path => "NUL"
MAC: sincedb_path => "/dev/null"
Now that our config file is ready, we can run logstash.
To run logstash . Go to the bin folder of logstash and then type logstash followed by -f and the config file path with name, as shown below:
cd D:\2020\Logstash\logstash-7.7.1\logstash-7.7.1\bin
D:\2020\Logstash\logstash-7.7.1\logstash-7.7.1\bin>logstash -f "D:\2020\Logstash\data\logstash_movies.config"

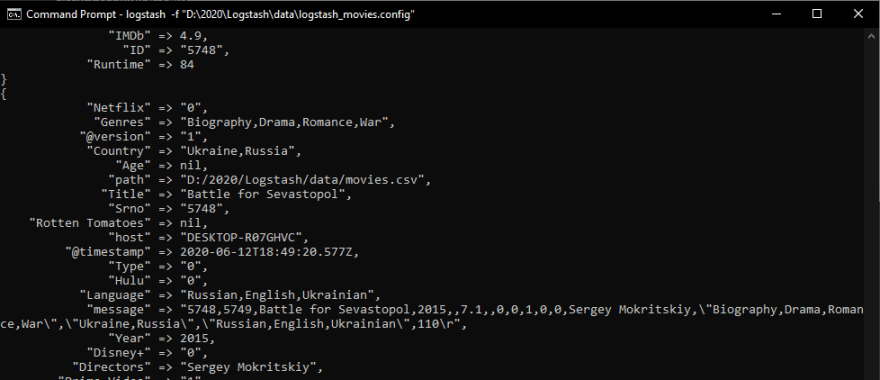
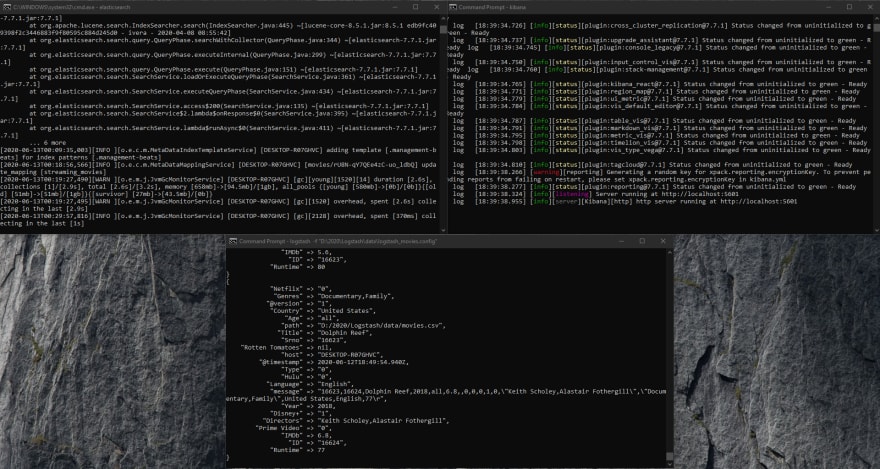
If everything is in order then logstash will process the CSV file and feed it to elasticsearch. Once the CSV file is being read, it will log it to the console, as below:
Note that all three consoles must be running, do not close any of the consoles, as shown in the screenshot below:
In order to visualize data, we need to create the index pattern. This index pattern is the same parameter which we specified in the config file.
From the home page of kibana, head to Management by navigating for the left pane, as shown below:
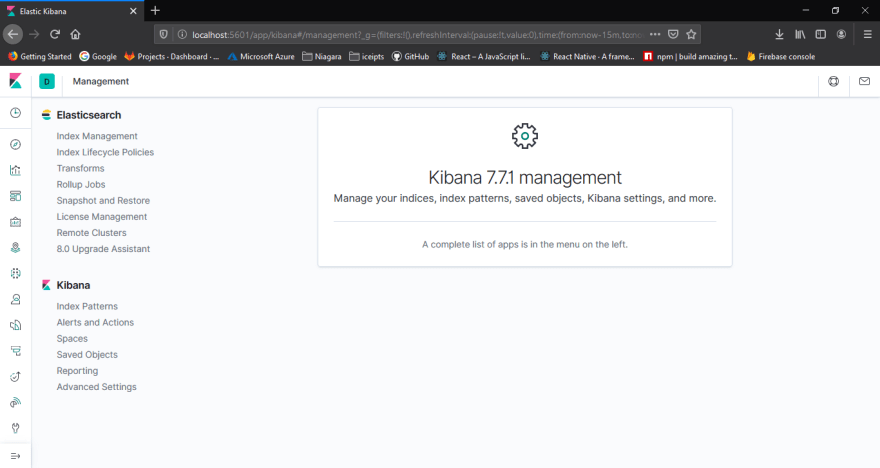
Under management on the left side, you will have two options Elasticsearch and Kibana. Under Kibana, click on the Index Patterns. You will see as the screenshot below:

As seen above, there are no search patterns created. We need to create a index pattern. Click the + Create index pattern button on the top right corner. Creating an index pattern is a two step process.
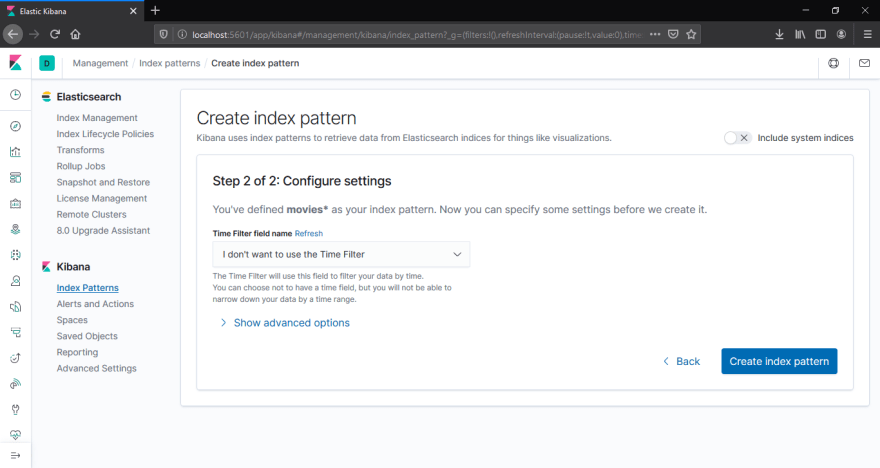
In the first step, specify the index pattern name as movies*. You should able to see Success! ... in green text. Then click on Next step.

In the second step, In Configure settingsunder Time Filter field name, you can select I don't want to use the Time Filter and click on Create index pattern.
Now you should be able to see the newly created index pattern under index pattern, as below:

Here you get to see the columns names along with their datatypes, format, searchable, aggregatable etc.
Once the index pattern is create, you are now ready to visualize the data. But before that you can explore few options in kabana like Discover and Dev Tools
Under Dev Tools you can query the following:
movies get all endpoint:
GET /movies

movies search endpoint:
GET /movies/_search
{
  "query": {
    "match_all": {}
  }
}

movies count endpoint:
GET /movies/_count

Under Discover you get to see the data records:

Following is the screenshot with the record expanded:

Now lets take a look at kibana visualization
Head to Visualize page, you should able to see as below:
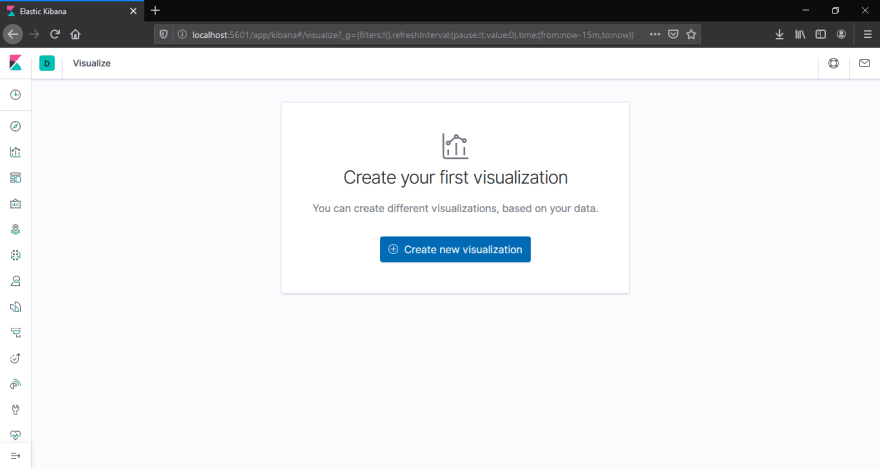
Click on + Create new visualization. A pop up screen will ask you select a visualization type, lets select Pie.

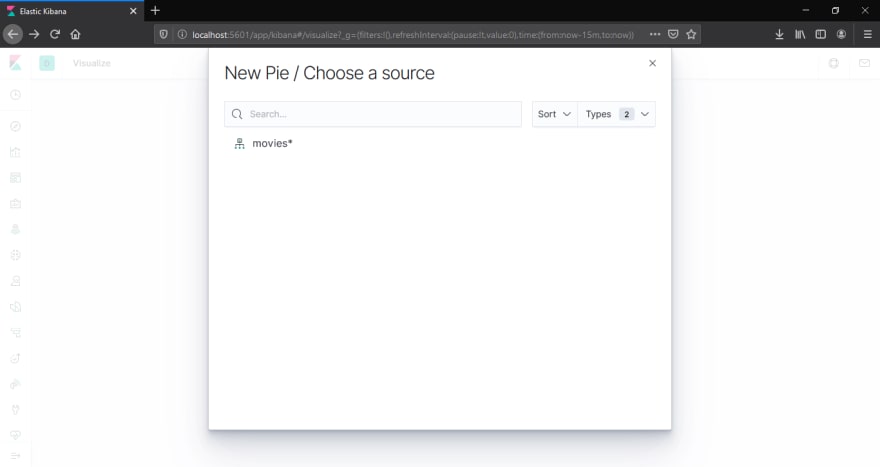
On selecting Pie, the pop up will ask you to choose a source, it is the index pattern, select the index pattern: movies*
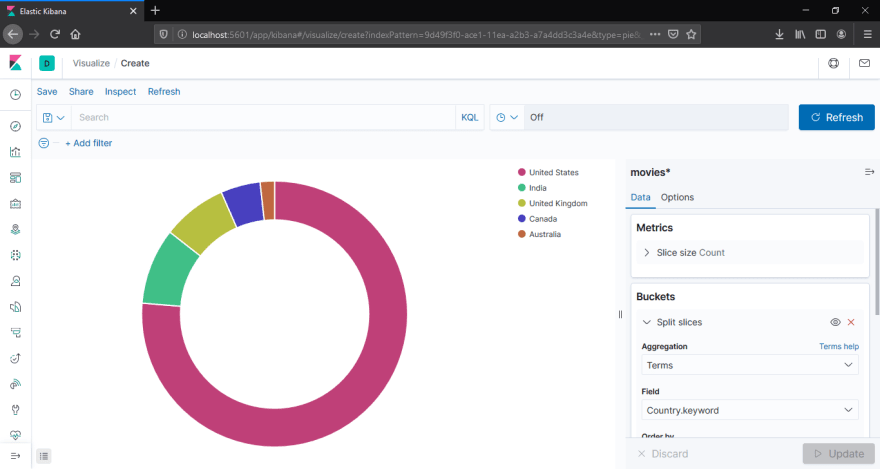
On the right side, you will see Buckets, click on Add and select Split slices

Next, select Aggregation to Terms and select any field of your choice. In this case I've selected Country.keyword. This will populate the pic chart by countries, as shown below:
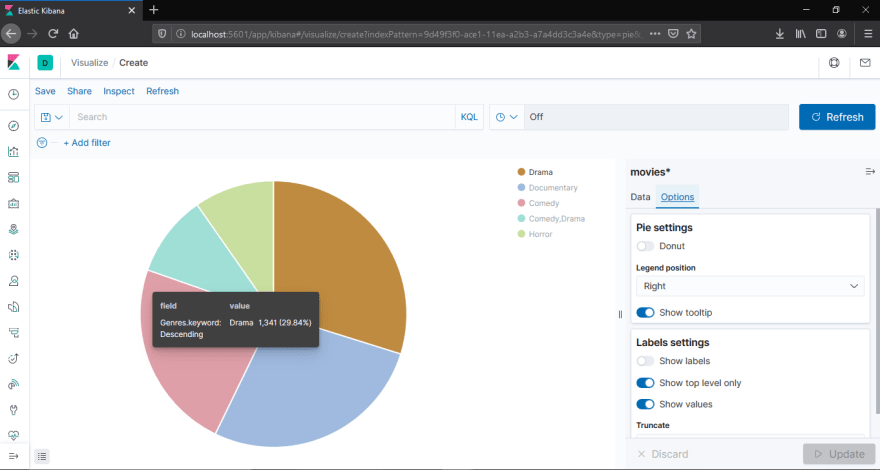
You can also do some customization under Options tab. Example: you can change the pie from donut, show or hide tooltip, label settings etc.
Finally, after making the desired changes, you can save the visualization, as below:
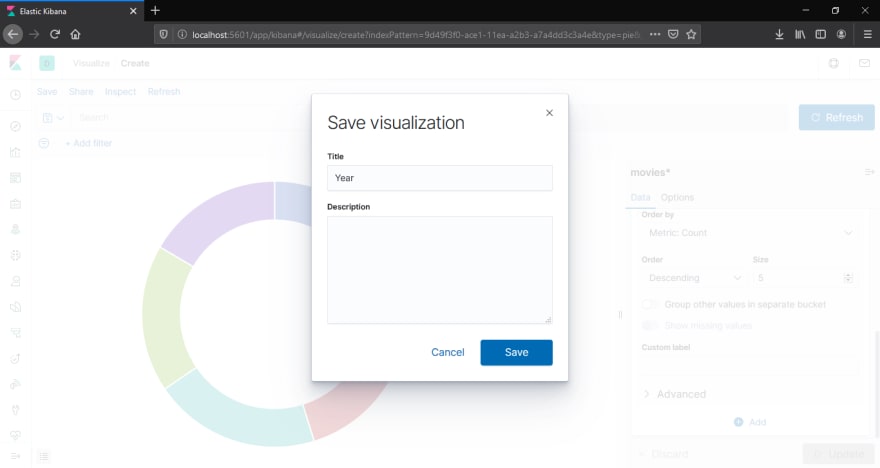
The saved visualization can then be used in dashboard.
Finally, Dashboard
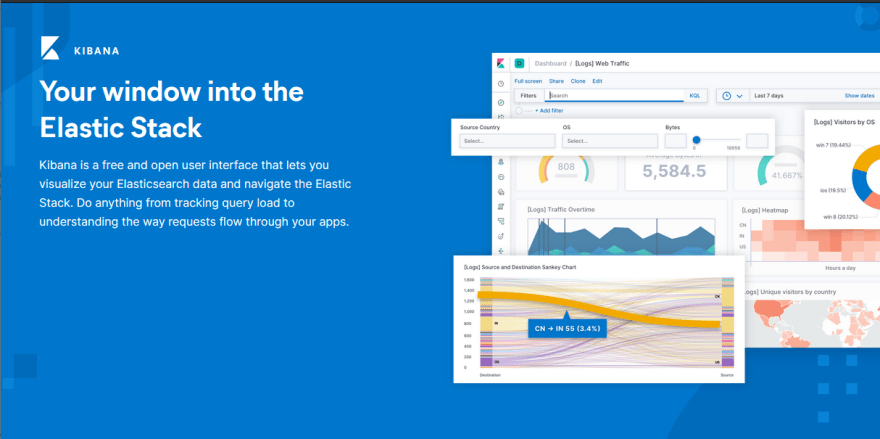
We can create advanced dashboard like below screenshot from their official site, but we'll create a simple dashboard:

Dashboard contains visualization which we created in the previous step. To create a dashboard, head to Dashboards

Click on the + Create new dashboard button

On the next screen, you will asked to choose panels, which are nothing be the visualization which you have created, or you have an option to create a new one.

Then save the dashboard:

Our final dashboard looks as below:

You can find the config file and the CSV file on my github page MilburnGomes
See also
https://www.elastic.co/
That's it for the ELK stack, hope you have enjoyed and understood it as well.
Thanks for reading!

Top comments (0)