To think if GCP as a simplified infrastructure is something really positive to say. Not a feigned compliment cos we can all see it from the singleness of the platform.
I used GCP provisioned resources to create a streaming data pipeline for a real-time dashboard with dataflow.
- I sourced a public streaming dataset (PubSub Topic) gathered of the NYC Taxi Rides, collected from google public pubsub data.

After signing in to my GCP Cloud Account, I navigated to "BigQuery" on the side-nav, would thereafter use my command line to create a dataset called taxirides.
On the command line, i run 'bq mk taxirides' to make a dataset under my project.
I would thereafter create a table in my dataset with my specified schema - the blueprint of my table data.
bq mk \
--time_partitioning_field timestamp \
--schema ride_id:string,point_idx:integer,latitude:float,longitude:float,\
timestamp:timestamp,meter_reading:float,meter_increment:float,ride_status:string,\
passenger_count:integer -t taxirides.realtime
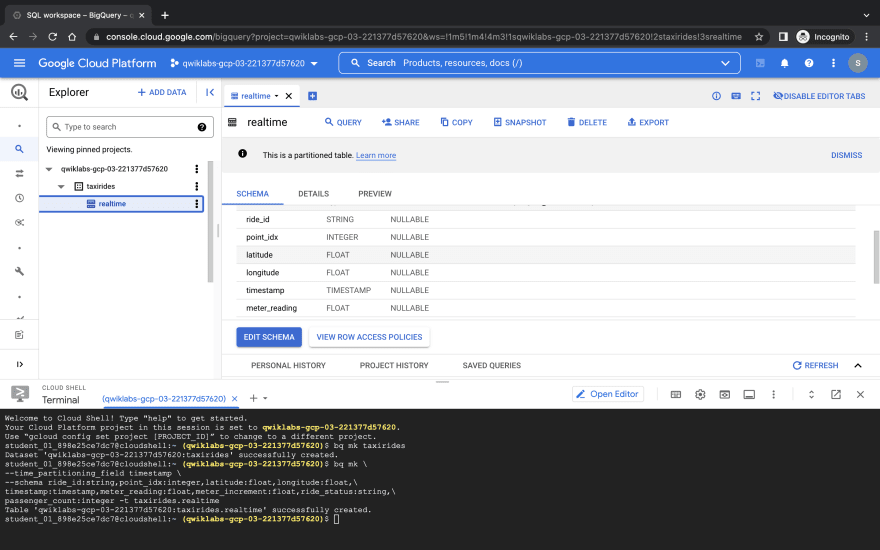
My Schema has been successfully created, and you can clearly see it on a dropdown showing on the left of the screen.
Before creating my data pipeline, i'd create a bucket on my GCP Cloud Storage to serve as my data lake.
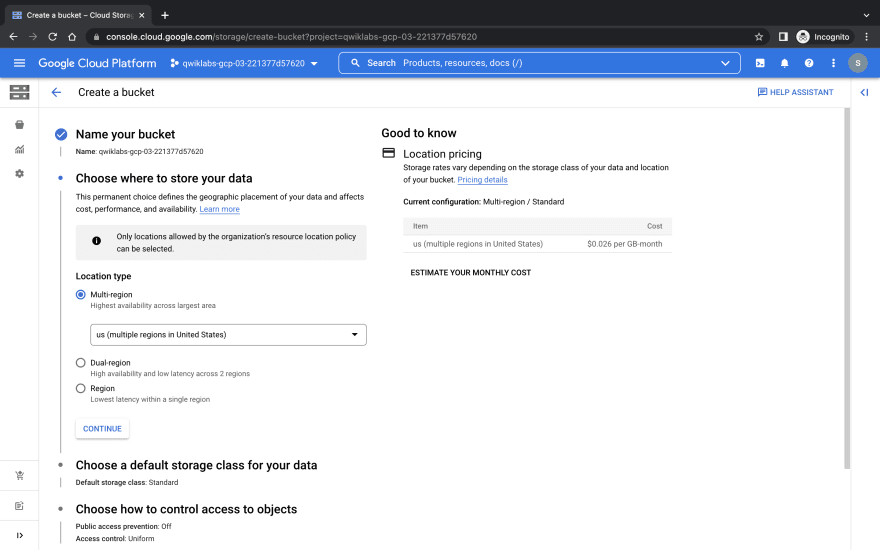
Named the bucket with my project ID and selected a multi-region.

And i have my bucket!
The Next thing to do is to be sure to enable the Dataflow Api, as this would be serving out dataflow pipeline.

I searched for it on the search bar and voila! it's there.

I'd click on "Manage", disable and enable the API.
After enabling the API, i'll proceed to create my Pipeline from an existing template on Dataflow.

Right Here!

I'll start by creating a Job from a template,

Insert my Job name, and select "PubSub Topic to BigQuery" considering where my data is coming from.

I fill in the required parameters comprising of the PubSub Topic link, my dataset location as an output, and a temporary location.

After filling the values, i'd make sure to specify the number of compute engine instances - Max workers as 2, number of workers as 2.

Then i run the job. A data pipeline is created after this and i can refresh my cloud storage bucket now, before i move to check the data on BigQuery.


Have it in mind that, BigQuery was the output of the Dataflow Pipeline.

Now i successfully have my Datasets on my BigQuery.
we can Perform aggregations on the stream for reporting, i'll navigate to the query option and input my query
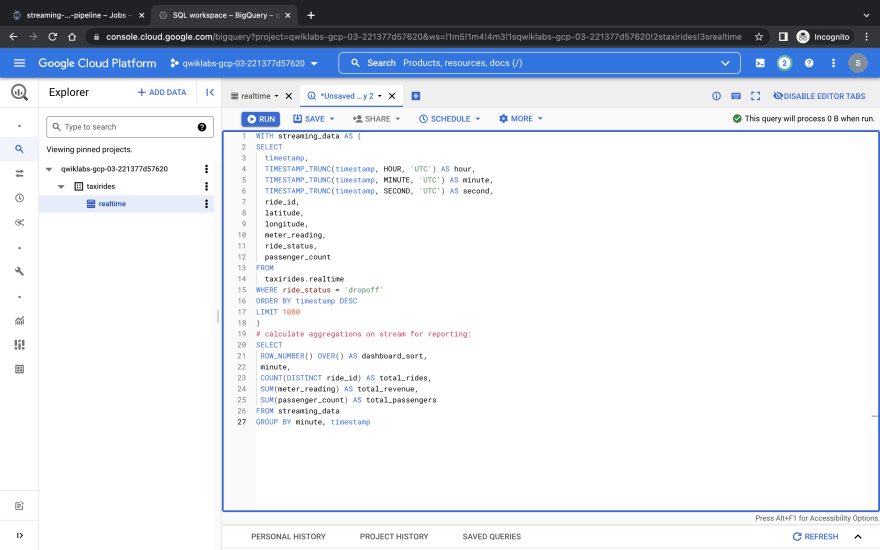

I can also choose to save this transformed result back to my Data Warehouse or anywhere else. I can also do this using a scheduled query that returns the same transformed data on a streaming pipeline.

I choose to explore with Data Studio.


On the Reports page, in the Start with a Template section, click the [+] Blank Report template.
If prompted with the Welcome to Google Studio window, click Get started. Check the checkbox to acknowledge the Google Data Studio Additional Terms, and click Continue.
Select No to all the questions, then click Continue.
I switched back to bigquery and explore with data studio again.

I selected a Combo Chart and i specified
Date range Dimension: dashboard_sort
Dimension: dashboard_sort
Drill Down: dashboard_sort (Make sure that Drill down option is turned ON)
Metric: SUM() total_rides, SUM() total_passengers, SUM() total_revenue
Sort: dashboard_sort, Ascending (latest rides first)

NB: Visualizing data at a minute-level granularity is currently not supported in Data Studio as a timestamp. This is why we created our own dashboard_sort dimension.

Top comments (0)