Before I dive deep into the main topic of CI/CD ( Continuous Integration and Continuous Delivery) of Power BI, I would like to give a very quick overview of Power BI.
Power BI is a popular and powerful BI ( Business Intelligence ) tool. For four consecutive years, Power BI has been reported as a leader in the Gartner Magic Quadrant ( link to garnet in 1st comment ). Other popular BI tools are Tableau, Microstrategy, Qlik Sence, Superset, and many more; the list is long.
The primary function of any BI Tool is to:
- Collect and transform data from multiple sources
- Help uncover the data trends and outliers
- Help create easy and impactful data visualization
- Action-oriented insights
"Gartner has recognized Microsoft Power BI as a Magic Quadrant Leader in analytics and business intelligence platforms."
As the business grows, it needs more analytics, more accurate data in a single report, and quick access to trends; as a developer, the challenge is the get out the dashboards and reports in the fastest possible way along with reliable data, which is more recent, more accurate, more realtime. Manual deployments are error-proper and time-consuming, so CICD comes to the developers' rescue.
"Doing deployments and release management manually can be error-prone and time-consuming."
CI/CD Process can help the BI Developers achieve these five things
- Simply the deployment process: improve team productivity
- Reduces manual work and errors: fewer bugs
- Reduces deployment time: quick turnaround time
- Ease of use and improved collaboration: teamwork
- Automate the process and make it reusable: automation
"Seamless CICD process reduces errors, deployment time and increases team collaboration"
By now, we understand the benefits of CICD, so let's look at the different ways; there are two approaches to implementing CICD in Power BI.
- Power BI Service Deployment Pipelines ( within Power BI Service )
- Azure DevOps and Power BI CICD using Service Principal ( with Azure DevOps )
In this article, I will cover the 1st Option within Power BI Service.
Without CICD, the BI creator has to publish the Dashboards manually in Dev, Test, and Prod. There are some difficulties in publishing a PowerBI Report directly from PowerBI Desktop, which includes
a. The developer must be the admin or have access to the Workspace; otherwise, can't able to do any procedures.
b. PowerBI Desktop has to be connected to all the environments ( Dev, Test, and Prod ) to do the deployment which is not very safe
c. The developer needs to manually change the data source settings for every environment
Power BI Deployment Pipelines is a simple five Step process
- Create a deployment pipeline with DEV, QA, and PROD environments
- Assign workspace to each environment
- Develop and Publish the contents to the DEV workspace
- Deploy it in the QA and PROD workspace with a click of a button
- Share it with users through the Workspace or the App
Detail Steps
[Step 1] Create Deployment Pipeline
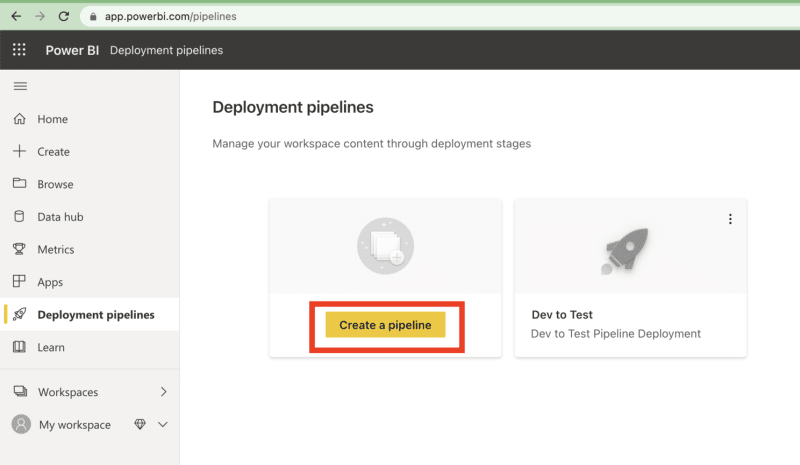
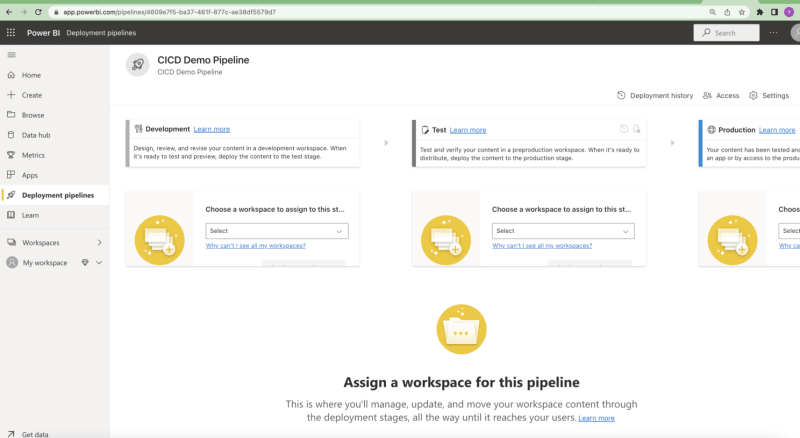
Go to app.powerbi.com and look for the rocket-like icon, click on the icon, it will open an option to create a pipeline, hit that button and it will prompt for the pipeline name, enter CICD Demo Pipeline, once you hit the create button it will present you three environments ( DEV, TEST, and PROD ) and an option to assign workspaces
[Step 2] Assign workspaces
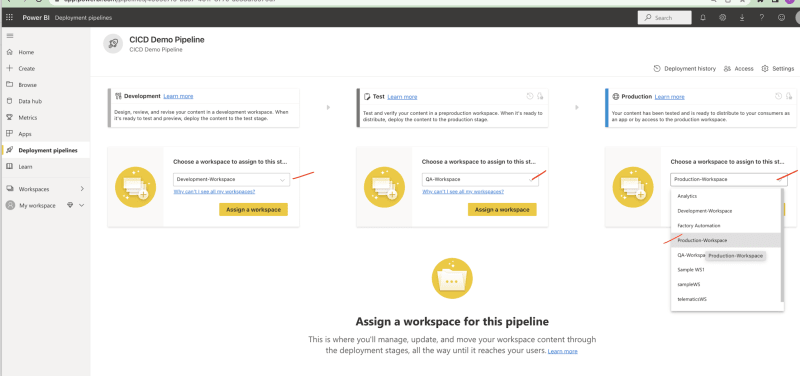
Here we can see three environments ( DEV, TEST, and PROD ) and an option to assign workspaces; from the drop-down, give Development-Workspace to the DEV environment, QA to Test Environment, and PROD to the production environment. It should look something like this before and after the assignment.
[Step 3] Develop and Publish Dashboard to Development Workspace
For this article, I will be using a sample dashboard from the Microsoft portal, the link to the portal is in the first comment
Since I am reusing an already developed Sales & Returns Dashboard, let's open it into Power BI Desktop and hit the publish button in the right corner, choose Development-workspace while deployment
[Step 4] Deploy to (test) QA >> Deploy to Prod
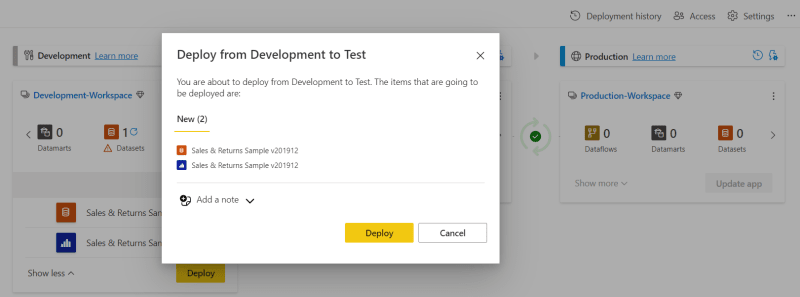
After the development of the dashboard is done and it's published in a development environment, the Data Flow, Data Set, and Dashboard will visible in the Development environment to publish, hit the "Deploy to test" button in the Dev environment, the Power BI Deployment Pipeline will copy all the contents from Development to QA in a couple of seconds if not minutes
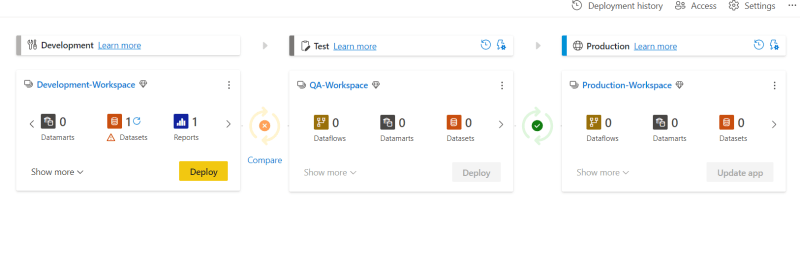
Ready for Test/Stage Deployment (empty QA and Prod Stages)
Hit the Deploy Button and the changes will be available in QA
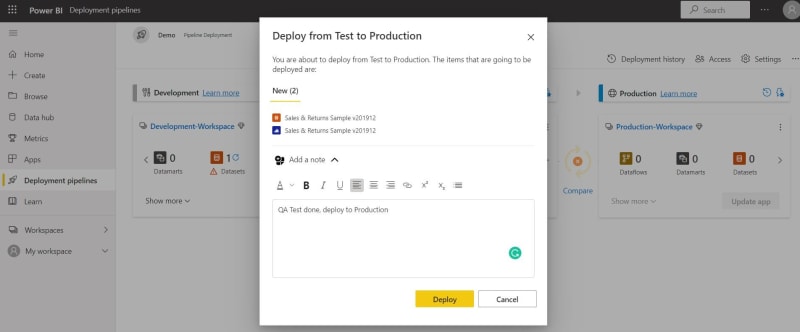
The deployment might take a few seconds if not minutes based on the size of the reports, Do a round of testing and take the sign-off from QA and Customers, once done hit the "Deploy to Prod" button, and the contents will be copied to the Production workspace.
[Step 5] Share it with the users through App or through the workspace
Go to the workspace where the deployment is done ( In all three stages of the pipeline, a link to the workspace is available, navigate to the link and view the report
Other Features
Comparing stages
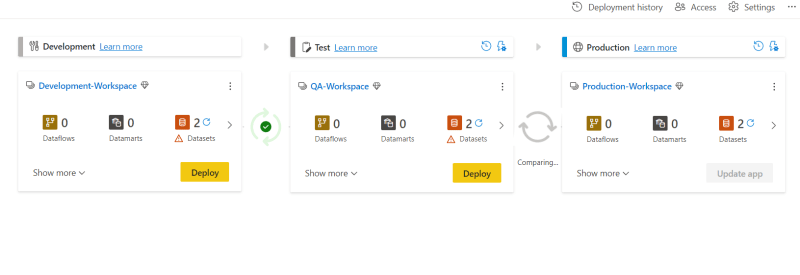
If there is any difference in DEV, test(Stage), or Production environment, that will be easily visible by an indicator in-between two stages, it does a comparison and then the indicator shows two states:
Green indicator: When the content item in both stages is exactly the same.
Orange indicator: When the content from both stages appears different or if there is a difference in the number of items.
Deployment History
A sequential, one-click release pipeline, with comparison and release history, is ready for your daily use, I hope you find this article informative and helpful to implement CICD in Power BI. Power BI Developers and Release managers let me know your thoughts on this article through comments
""Deployment Pipeline, Camparison Tool, Deployment Histroy, 3 top features in five steps, what else do you need ??""
Yes, let me know what else you need, it can be a) how to trigger the pipelines automatically b) approval flow in the pipeline c) selective deployment. Let me know your wishlist in the comment section and I will cover that in the 2nd part of this Power BI Deployment Article series
Cheers








Top comments (0)