In an earlier blog post we talked about how to stream data from the Mastodon timeline into an Apache Kafka® cluster. If you missed it, read it to learn how to connect to Mastodon and stream data into an Apache Kafka topic. This article assumes that you already have an Apache Kafka environment running with data in a topic that is called Mastodon.
Having magnitudes of data that is coming non-stop from a source (Mastodon timeline in our case!) brings us a new challenge - how to make sense of all this data? For instance, you may want to observe trends, search for particular entries, or filter and aggregate data to understand it.
The biggest advantage of bringing data into an Apache Kafka topic is that Apache Kafka provides a convenient mechanism to plug in other applications and reuse data for such cases as analytics, visualisations, metrics or long term storage. This all can be achieved with Apache Kafka® Connect with almost no code involved.
When talking about tools for search, aggregations and visualisations, a great place to start is OpenSearch®. OpenSearch is an open source search and analytics suite that has a powerful visual interface to work with data. It is straightforward to set up and start using, so why not let OpenSearch analyse the data coming from Mastodon?
To give you a visual picture, below is the architectural diagram connecting all the building blocks used in the previous article and the ones we will add in the current one:

In this post you will learn how to reuse the data you have in Apache Kafka with OpenSearch for visualisations and aggregations.
Set up OpenSearch
Both Apache Kafka and OpenSearch are available in the Aiven platform, so not only can you run them side by side, but also you can use a managed OpenSearch sink connector that connects these services.
Create an Aiven for OpenSearch service from Aiven Console (read more about OpenSearch in Aiven docs).
Once your service is created, make a note of the connection settings, you'll need them in the next section.
Use Kafka Connect to bring Apache Kafka and OpenSearch together
The easiest way to connect Apache Kafka with other tools is to use one of the already available connectors. Conveniently, there is an open-source sink connector for OpenSearch that you can use out of the box.
To add connectors to the running Apache Kafka cluster, enable Apache Kafka Connect in your Aiven for Apache Kafka service or consider using a standalone Apache Kafka Connect service.
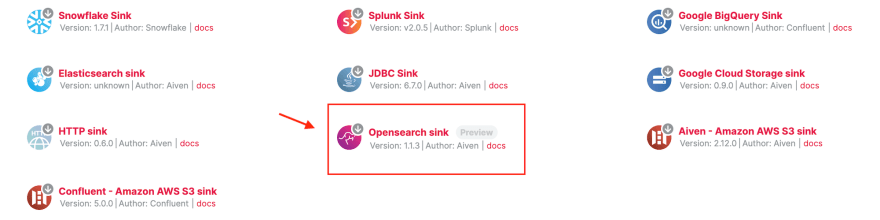
Navigate to the Connectors tab to create a new connector. In the long list of available options, select OpenSearch sink.
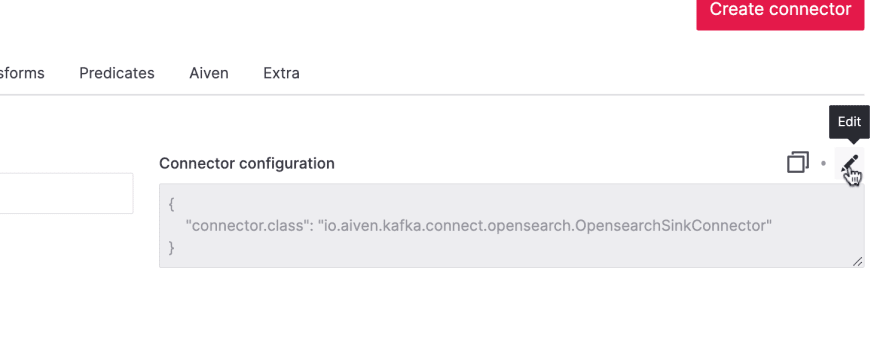
In the configuration page you can either enter properties manually, or speed it up by using a JSON object for connector configuration. Open the JSON editor by clicking on the pencil icon next to the connector configuration.
Below is an example of the configuration properties needed for the connection. Replace YOUR_OPENSEARCH_HOST, PORT, YOUR_SERVICE_USER and YOUR_SERVICE_PASSWORD with values taken from your OpenSearch service. These are the connection properties you saw when you created the Aiven for OpenSearch service.
{
    "name": "sink_mastadon_json",
    "connection.url": "https://YOUR_OPENSEARCH_HOST:PORT",
    "key.ignore": "true",
    "connector.class": "io.aiven.kafka.connect.opensearch.OpensearchSinkConnector",
    "connection.username": "YOUR_SERVICE_USER",
    "schema.ignore": "true",
    "tasks.max": "1",
    "connection.password": "YOUR_SERVICE_PASSWORD",
    "key.converter": "org.apache.kafka.connect.storage.StringConverter",
    "value.converter": "org.apache.kafka.connect.json.JsonConverter",
    "topics": "mastodon",
    "value.converter.schemas.enable": "false"
}
If you want to know more about the available options, check the documentation for the OpenSearch sink Kafka connector .
Once you define the values, copy this data to the Apache Kafka connector configuration and press Apply.
Click to create the connector and wait for the status to be changed to RUNNING, at this point the data is flowing to OpenSearch. If there are any issues during the connection, you'll see an error message, and more information will be available in the logs.
Now the data from your Apache Kafka topic is sinking into the OpenSearch index. The default name of this newly-created index in OpenSearch is the same as the Kafka topic name.
Time to look at the data in OpenSearch with the help of OpenSearch Dashboards!
Log in to OpenSearch Dashboards
To see the data in OpenSearch, open OpenSearch Dashboards using the Host, User and Password details from the "OpenSearch Dashboards" tab in the web console.
Once you're logged in, create an index pattern for Mastodon. An index pattern is a view for one or more indices that will be used together for aggregation. We have just one index, you can leave it as either Mastodon or Mastodon*. Use CreatedAt as the time field and you'll be able to filter your data by time.

Explore data with the Discover panel
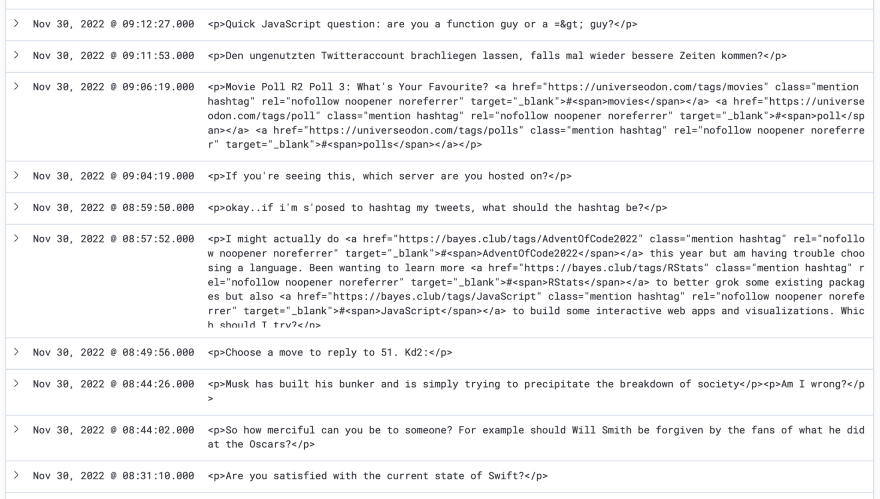
When you don't yet know much about the data, the discover panel is a great place to start. Here you can either view complete data objects, or choose specific properties you're interested in.

You can also filter, search and even look at pre-created visualisations for each of the available fields.
For example, if we are only interested in messages that include polls, add a filter to show only those records that have poll.id defined.

Once you apply the setting, you can see the latest polls.
What is interesting, however, is that if you look at poll.voterCount, the vast majority of polls don't get any voters. It seems that opinion polls are not always popular on Mastodon.
Create visualisations for aggregations
The discover panel is fun, but you might want to define a specific aggregation and visualise the result. OpenSearch Dashboards has a variety of options for this. Look at the list of available visualisations. Each of them comes with a set of properties to shape the targeted aggregation. Here are a couple of examples:
Tag clouds
To quickly see what tags are popular for the latest messages you can use a tag cloud. Create a new bucket, set Aggregation to terms and tags to tags.name.keyword. To get more tags in your cloud, increase the size property.
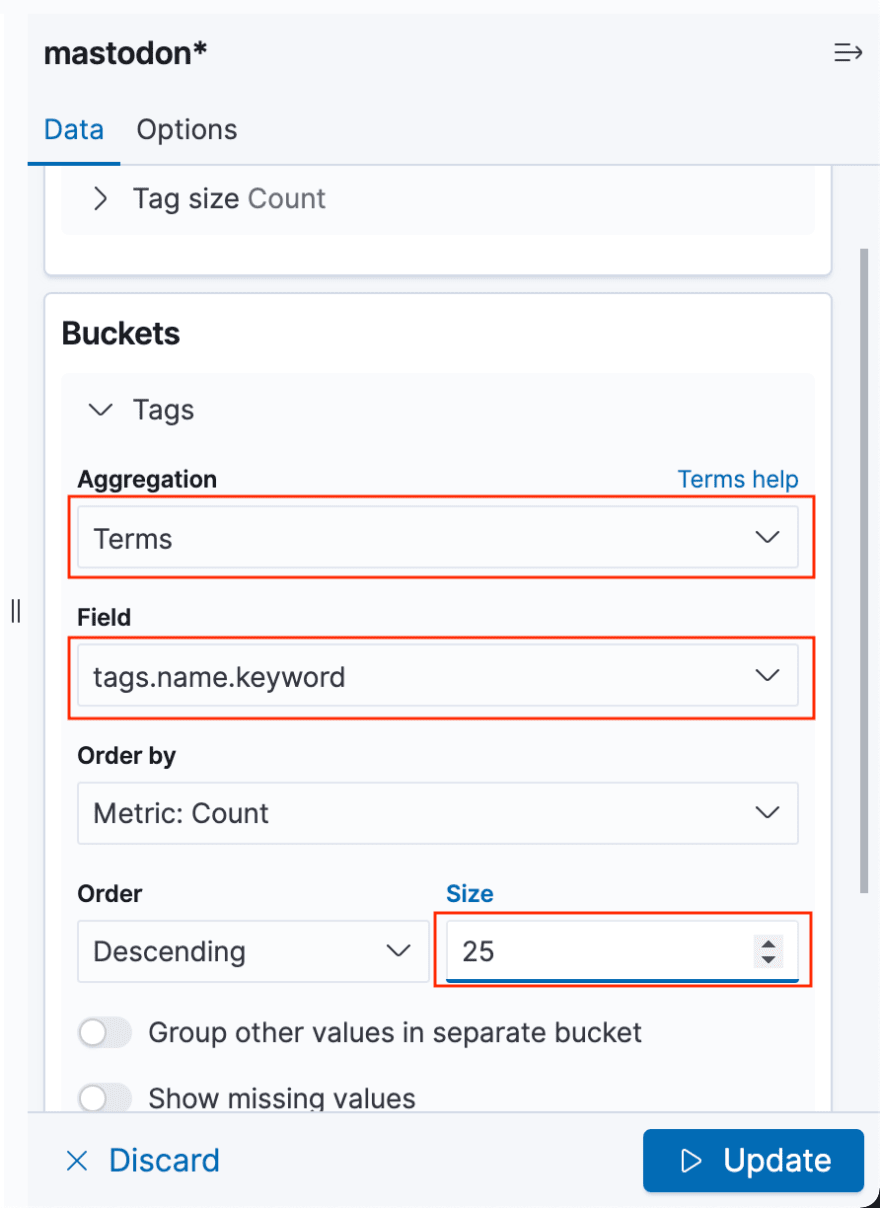
Click Update and you'll see a tag cloud of the most popular Mastodon hashtags.

If you're thinking which Mastodon tag is best to follow, search for some keywords and see what tags pop up. If you're a dog lover, apply the content:dog filter to see which tags have dog-related content 🐕.
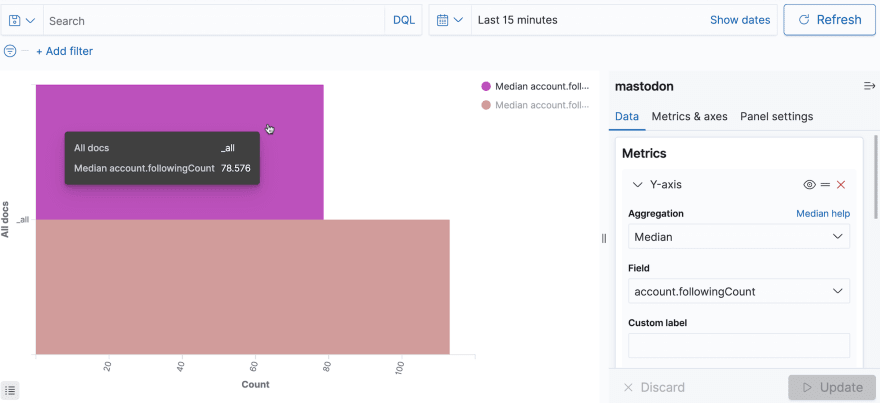
Bar visualisations
Bar visualisations are useful to compare different values. To compare median values for the number of followers vs following users across accounts that posted the latest messages, create a horizontal bar visualisation.
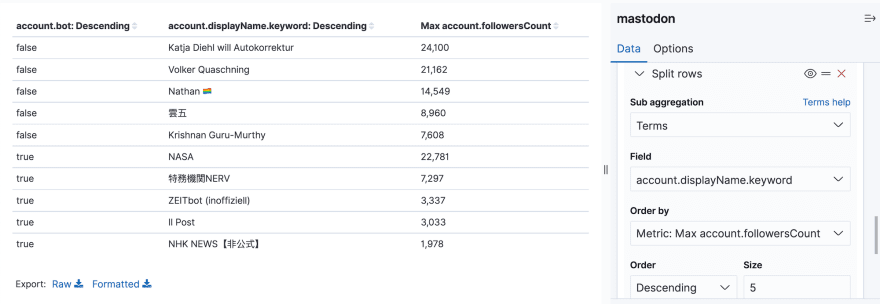
Table
If you're curious to know which users have the most followers, create a table to show information about the accounts with the highest number of followers.
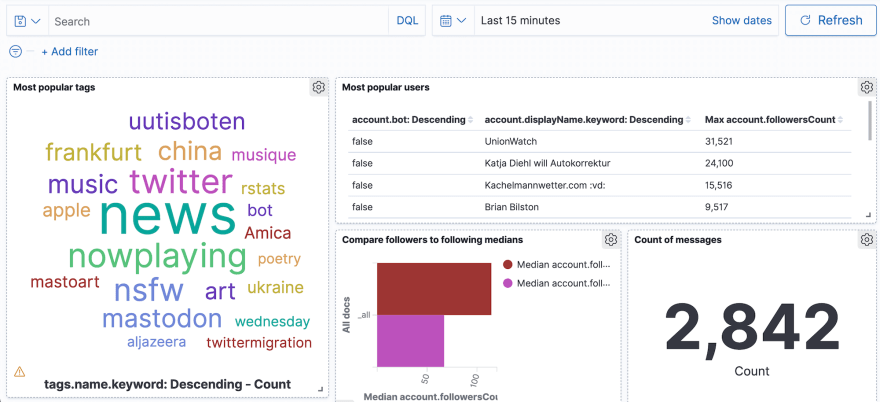
Organise visualisations in a dashboard
Once you have multiple visualisations, you can combine them into a dashboard. A dashboard will allow you to apply time constraints and filters to multiple visualisations at once.
The default time span is the last 15 minutes. If you can't see any data on your dashboard, make sure that you have recent data, or use the time field to apply a specific time span.
Find more uses for your data
Apache Kafka Connect offers enormous power to connect multiple systems together by creating data pipelines. In this example you saw how you can bring the data from an Apache Kafka topic to OpenSearch with no code needed. Our goal was to aggregate and visualise the data, which is why we used OpenSearch. In your own scenario, you might want to collect data from an Apache Kafka topic to sink it to a different database, or an object store such as S3, or put it into ClickHouse® for long term storage and analytics.
Tell us what you are building, what connectors you use, and which ones we should add next!

Top comments (0)