Effective Metrics and Alerts
Originally written at pooyan.info
Who is the author? Check out my profile on LinkedIn.
Monitoring your system effectively is crucial for maintaining performance and user satisfaction. Two popular methodologies for choosing what to measure and monitor are the USE Method and the RED Method. Let’s break down how each can guide you in setting metrics and alerts for optimal impact on business and user experience.
TL;DR
-
USE Method: Utilization, Saturation, Errors.
- RED Method: Rate, Errors, Duration.
- Alerts: Focus on business impact, user experience, and avoid alert fatigue.
What to Put Metrics On
The USE Method
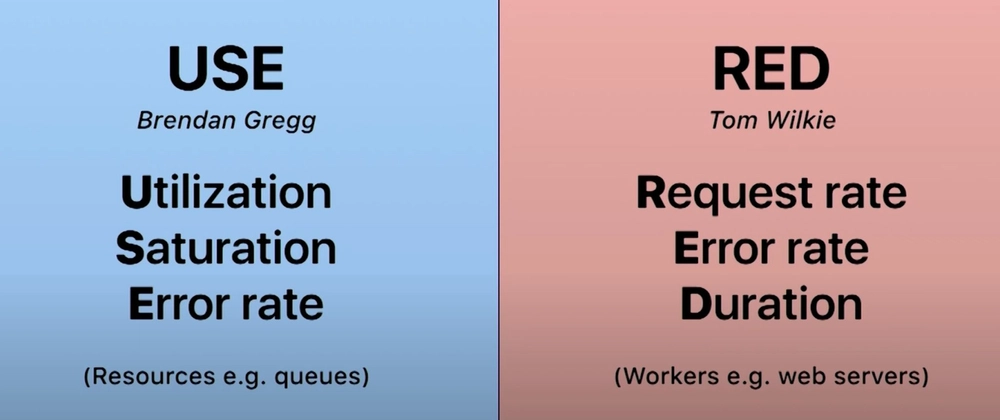
The USE Method, developed by Brendan Gregg, stands for Utilization, Saturation, and Errors. It's designed to help you systematically check the performance of your systems. Here's how it works:
Utilization: Measure the percentage of time a resource is busy. This helps you understand how much of the system's capacity is being used. For example, CPU utilization can indicate if your processors are overburdened or underused.
Saturation: Monitor the degree to which a resource is overloaded. This includes waiting times and queue lengths. For instance, if disk I/O saturation is high, it could signal bottlenecks.
Errors: Track the rate of errors, such as failed requests or corrupted data. Error rates can help identify issues before they escalate into major problems.
By focusing on these three aspects, the USE Method ensures a comprehensive view of system health, pinpointing areas that need attention.
The RED Method
The RED Method, popularized by Tom Wilkie, is tailored for microservices. RED stands for Rate, Errors, and Duration:
Rate: The number of requests per second. Monitoring this helps you understand the load on your service.
Errors: The number of failed requests per second. Keeping an eye on errors allows you to quickly detect and address issues.
Duration: The amount of time it takes to process a request. This metric helps you measure and improve the performance and responsiveness of your service.
The RED Method is particularly effective for tracking the health of microservices, offering clear insights into their behavior and performance.
What to Put Alerts On
Setting alerts is about more than just monitoring every possible metric; it’s about focusing on what truly matters to your business and user experience. Here’s a strategic approach:
Prioritize Business Impact: Alert on metrics that directly affect your business operations. For example, if an e-commerce site’s checkout process has high error rates, that should trigger an alert.
User Experience: Consider the end-user experience. Metrics like page load time and transaction success rates are critical. If these metrics degrade, users may abandon your service.
Avoid Alert Fatigue: Don’t overwhelm your team with too many alerts. Focus on the most critical metrics to avoid alert fatigue, ensuring that important issues get the attention they deserve.
Thresholds and Anomalies: Set thresholds for normal operation and trigger alerts when these thresholds are breached. Additionally, use anomaly detection to identify unusual patterns that could indicate problems.
By judiciously selecting what to measure and alert on using the USE and RED methods, you can maintain a robust, user-friendly system that supports your business goals. This balanced approach ensures that you’re prepared to address issues promptly without getting bogged down by unnecessary data.
Summary
The USE Method (Utilization, Saturation, Errors):
- Utilization: Measure the percentage of time resources are used.
- Saturation: Monitor overload levels (waiting times, queue lengths).
- Errors: Track the rate of errors (failed requests, corrupted data).
The RED Method (Rate, Errors, Duration):
- Rate: Monitor the number of requests per second.
- Errors: Track the number of failed requests per second.
- Duration: Measure the time taken to process requests.
Alerting Strategy:
- Prioritize Business Impact: Focus on metrics affecting business operations.
- User Experience: Monitor metrics critical to end-user satisfaction.
- Avoid Alert Fatigue: Limit alerts to the most critical issues.
- Thresholds and Anomalies: Set thresholds and use anomaly detection for effective alerting.
If you liked the article and want to keep me motivated to provide more content, you can share this article with your friends and colleagues and follow me here on Medium or LinkedIn.
Copyright & Disclaimer
- All content provided on this blog is for informational purposes only. The owner of this blog makes no representations as to the accuracy or completeness of any information on this site or found by following any link on this site.
- All the content is copyrighted and may not be reproduced on other websites, blogs, or social media. You are not allowed to reproduce, summarize to create derivative work, or use any content from this website under your name. This includes creating a similar article or summary based on AI/GenAI. For educational purposes, you may refer to parts of the content, and only refer, but you must provide a link back to the original article on this website. This is allowed only if your content is less than 10% similar to the original article.
- While every care has been taken to ensure the accuracy of the content of this website, I make no representation as to the accuracy, correctness, or fitness for any purpose of the site content, nor do I accept any liability for loss or damage (including consequential loss or damage), however, caused, which may be incurred by any person or organization from reliance on or use of information on this site.
- The contents of this article should not be construed as legal advice.
- Opinions are my own and not the views of my employer.
- English is not my mother-tongue language, so even though I try my best to express myself correctly, there might be a chance of miscommunication.
- Links or references to other websites, including the use of information from 3rd-parties, are provided for the benefit of people who use this website. I am not responsible for the accuracy of the content on the websites that I have put a link to and I do not endorse any of those organizations or their contents.
- If you have any queries or if you believe any information on this article is inaccurate, or if you think any of the assets used in this article are in violation of copyright, please contact me and let me know.

Top comments (0)