
What is Loadsy?
Loadsy [https://www.loadsy.io] is a new kid on the performance testing block. The domain is 800+ days old. First registered on 2019-10-22.
Loadsy is a tool for software developers for performance tests right from the terminal. Writing performance tests from the terminal is not new. Tools like k6, locust have already done this for the past many years.
Loadsy supports writing performance tests in JavaScript on the online IDE as well (from the look and feel, I guess its Monaco editor which powers the VS Code).
Features
Using Loadsy, it is easy to get started with the simple load test. It supports various load profiles such as spike, stress, and more. Loadsy has two flavors: online and CLI.
It gels with the CI/CD automation tools and the reporting user interface is fluid and intuitive.
You can check other features such as reports, and others on their website.
Pricing
The free tier in Loadsy looks peculiar. You can run unlimited tests with 512 threads tops with a duration of 30 seconds for free. The free tier is not a generous offer from Loadsy team.
$20/month enables 500 hours with unlimited threads/tests/duration.
$500/month enables 12,500 hours with unlimited threads/tests/duration.
$1000/month enables 35,500 hours with unlimited threads/tests/duration.
For more than 35,000, you need to contact the sales.
Getting Started with Loadsy
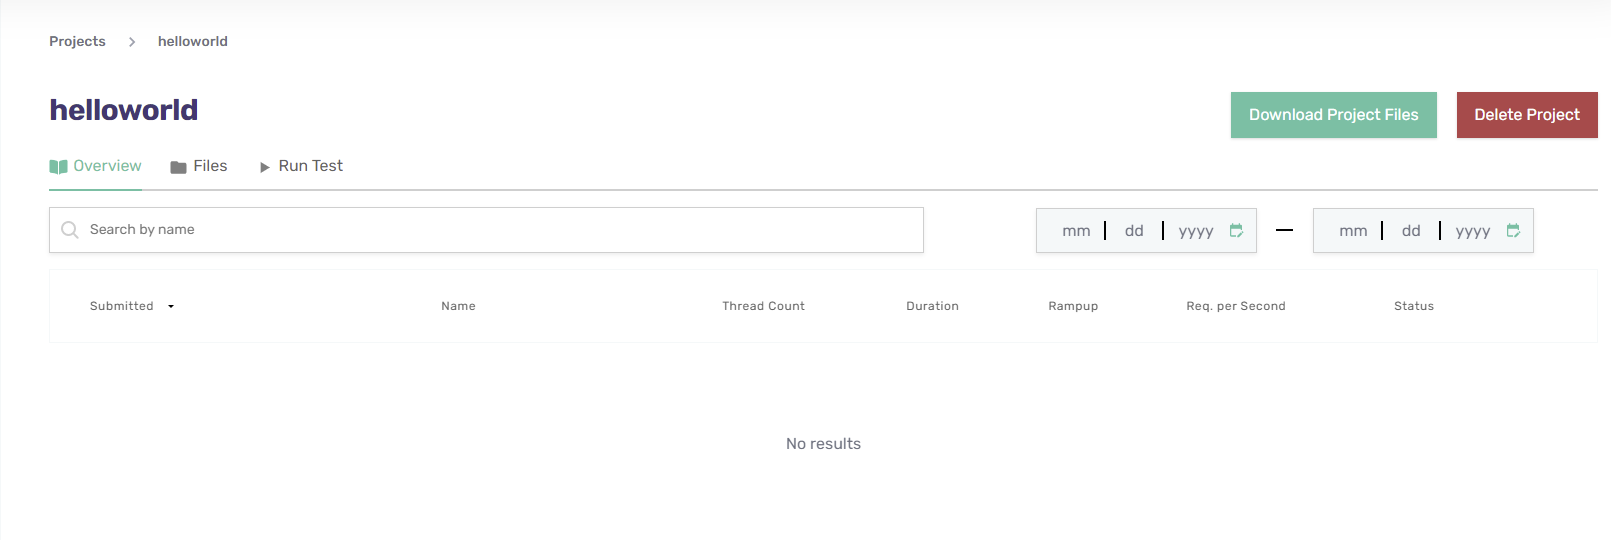
Head to loadsy.io to sign up for a free account and login. The first step is to organize your tests into projects.
Create a new project by clicking on the Create Project button and enter a valid project name, e.g. helloworld. Click on the helloworld project to create scripts and run tests.
Click on the Files folder icon which will launch the online IDE. Click on example.ts under the scripts folder to write the tests.
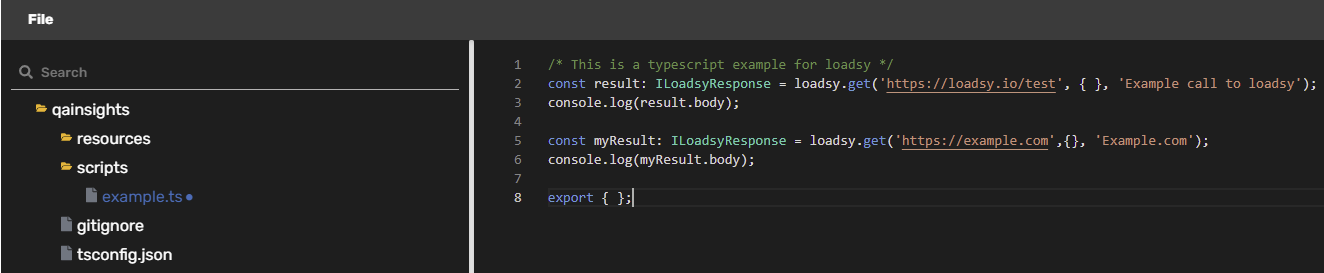
By default, example.ts will have a placeholder script.
/* This is a typescript example for loadsy */
const result: ILoadsyResponse = loadsy.get('https://loadsy.io/test', { }, 'Example call to loadsy');
console.log(result.body);

export { };
For the demo purpose, let us add a few more lines to the script. The sleep number is in milliseconds.
/* This is a typescript example for loadsy */
const result: ILoadsyResponse = loadsy.get('https://loadsy.io/test', { }, 'Example call to loadsy');
console.log(result.body);
console.log(result.status);

loadsy.sleep(3000);

export { };
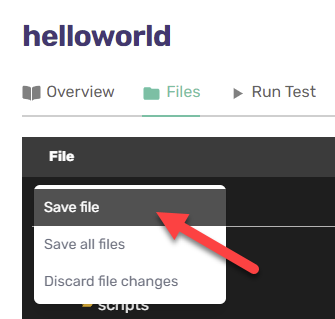
Go to File > Save file to save the script.
Run tests
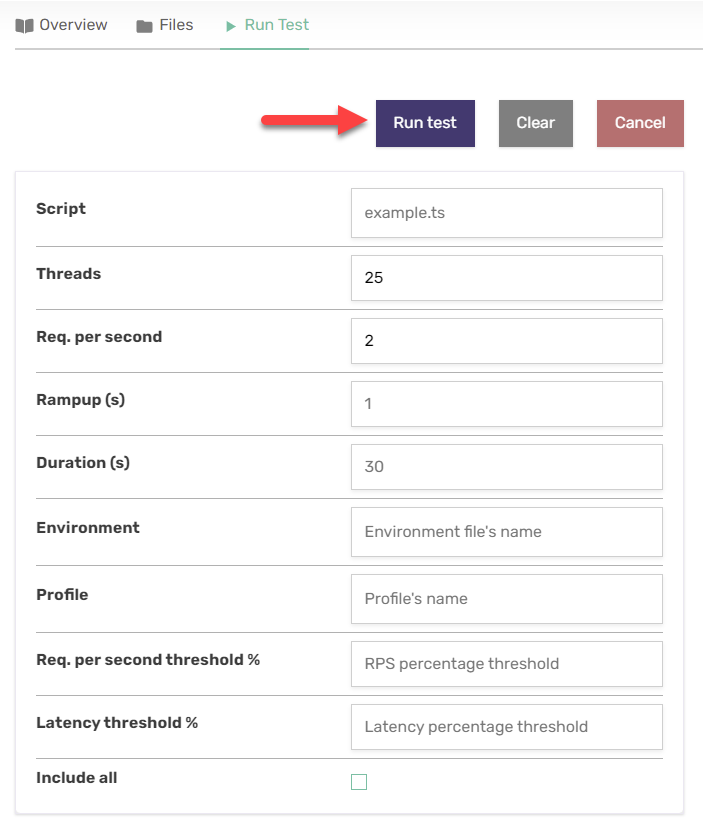
The next step is to execute the performance test from the UI. Click the Run test tab to configure the parameters for the performance test.
By default, it will autopopulate the values. But if you wish to modify, enter the valid value. In this demo run, it will inject 25 threads w/ 2 requests per second for 30 seconds.
Click on the Run test button to start the test.
Upon clicking on the Run test button, Loadsy will begin the test and display the stats on the right side as shown below. The below response time is in milliseconds.
Results Analysis
Once the test is done, to view the results, click on the Overview tab and then navigate to the test.
Loadsy will display the critical stats like threads, start/end time, status, and more on the left side. The Logs section displays the console.log messages.
Under the Calls, performance stats like response time, RPS, Total Requests and more will be displayed.

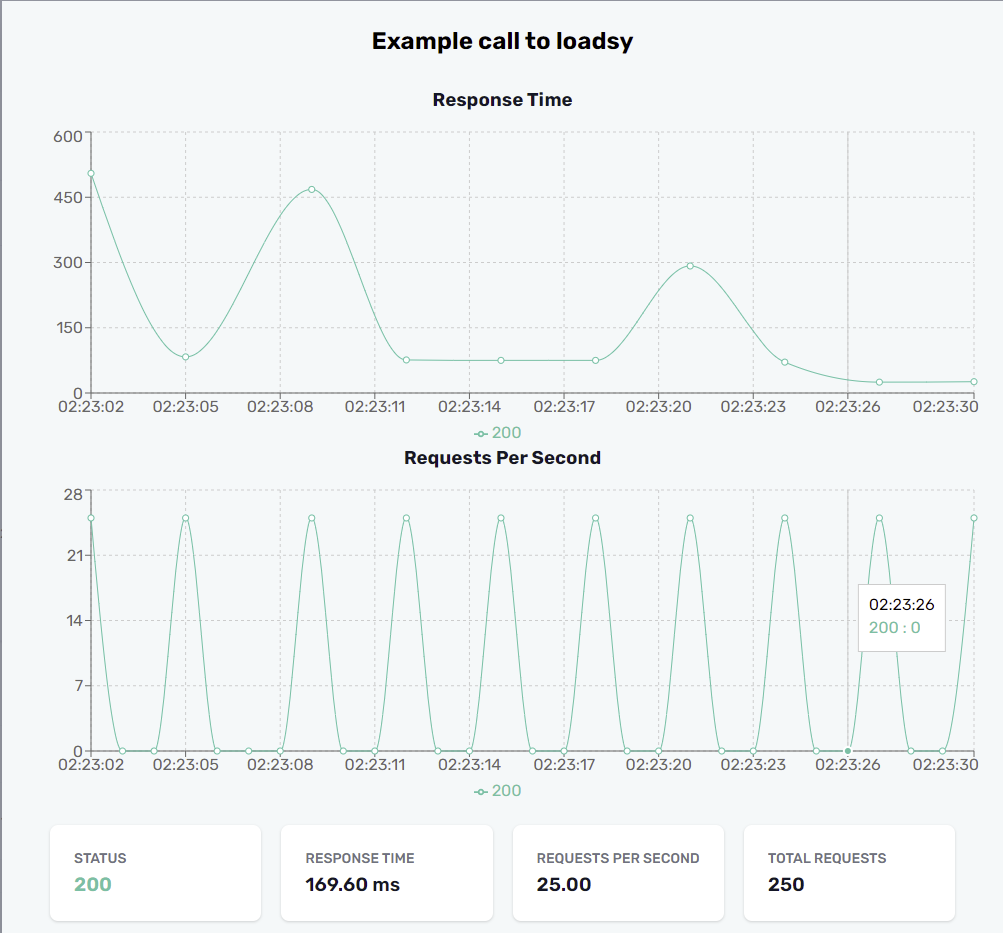
By clicking on the Graph icon under the calls, opens the graphical representation of the results. Right now, only two graphs are available: Response time vs Time and Request Per Second vs Time.
Loadsy CLI
Most of the developers and system admins hate the user interface. Enter loadsy CLI. Loadsy CLI is available as a npm package.
The only prerequisite is to have Node.js installed. Node.js is a JavaScript runtime environment to run JavaScript where npm is a package manager.
Head to https://nodejs.org/en/download/ to install Node.js and npm.
Below is my node and npm version.

To install loadsy, enter npm install -g @loadsy/cli
To validate the installation, enter loadsy -V. The current version is 2.0.7.
To view the help, enter loadsy -h.
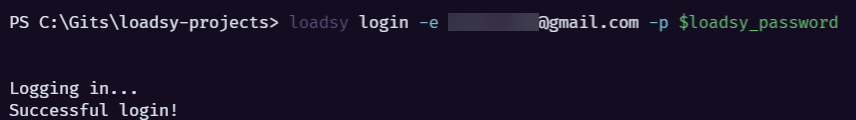
The first step is to login into your Loadsy account in the CLI.
Enter the below command to login. I have stored my Loadsy password in the variable on PowerShell.
loadsy login -e <email_id> -p $loadsy_password
The second step is to create a project. Enter the below command to create a project called MyPerf-Project. This will create a typescript project in your current directory.
loadsy create MyPerf-Project --typescript
Writing Tests
The next step is to write performance tests in your favorite editor. I recommend VS Code. Open scripts\example.ts file and paste the below code.
Below block sends two requests: one is GET to loadsy.io/test and another one is POST to reqres.in to create a user.
/* This is a typescript example for loadsy */
const result: ILoadsyResponse = loadsy.get('https://loadsy.io/test', { "accept":"*/*" }, 'T00_Loadsy');
console.log(result.status);

loadsy.sleep(1000);

const createUser: ILoadsyResponse = loadsy.post('https://reqres.in/api/users',{"Content-Type": "application/json" },{name:"morpheus",job:"leader"}, 'T10_CreateUser');
console.log(createUser.status);
console.log(createUser.body);

loadsy.sleep(1000);

export { };
Save the script.
The next step is to compile the script using loadsy build command which creates a JavaScript file under .build folder. Once the compiling is successful, it is time to upload the project to Loadsy dashboard.
Enter loadsy upload which uploads the scripts to your account.
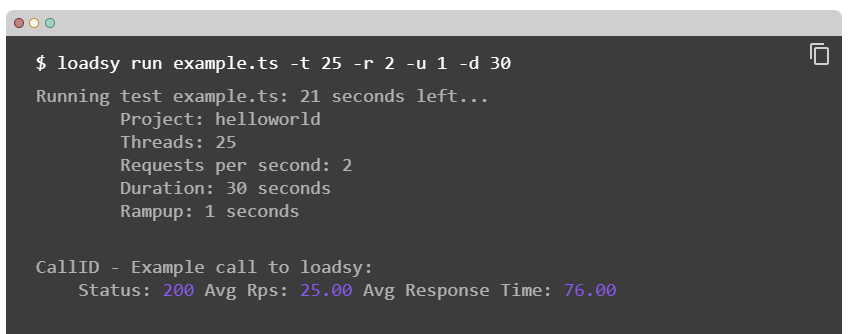
To start the test, enter loadsy run example.ts which will start the test.

To view the details stats, login into your Loadsy dashboard, navigate to the project, then click on the tests.
Under the Calls section, you can see the below records.

Conclusion
Loadsy certainly fulfills the basic needs of performance testing. The support for CLI and the web interface, profiles, developer-friendly, CI/CD integration, CSV support, managing the users, billing, and more are the selling points of Loadsy.
But under the hood, how it works, its infrastructure, distributing the load, integrations with APM and Observability tools, on-premise deployment, recording, multiple protocols, cloud integrations, and more are still a question mark.
As a performance engineer, you should definitely try Loadsy for once.

Top comments (0)